Fig. A.1
Download original image
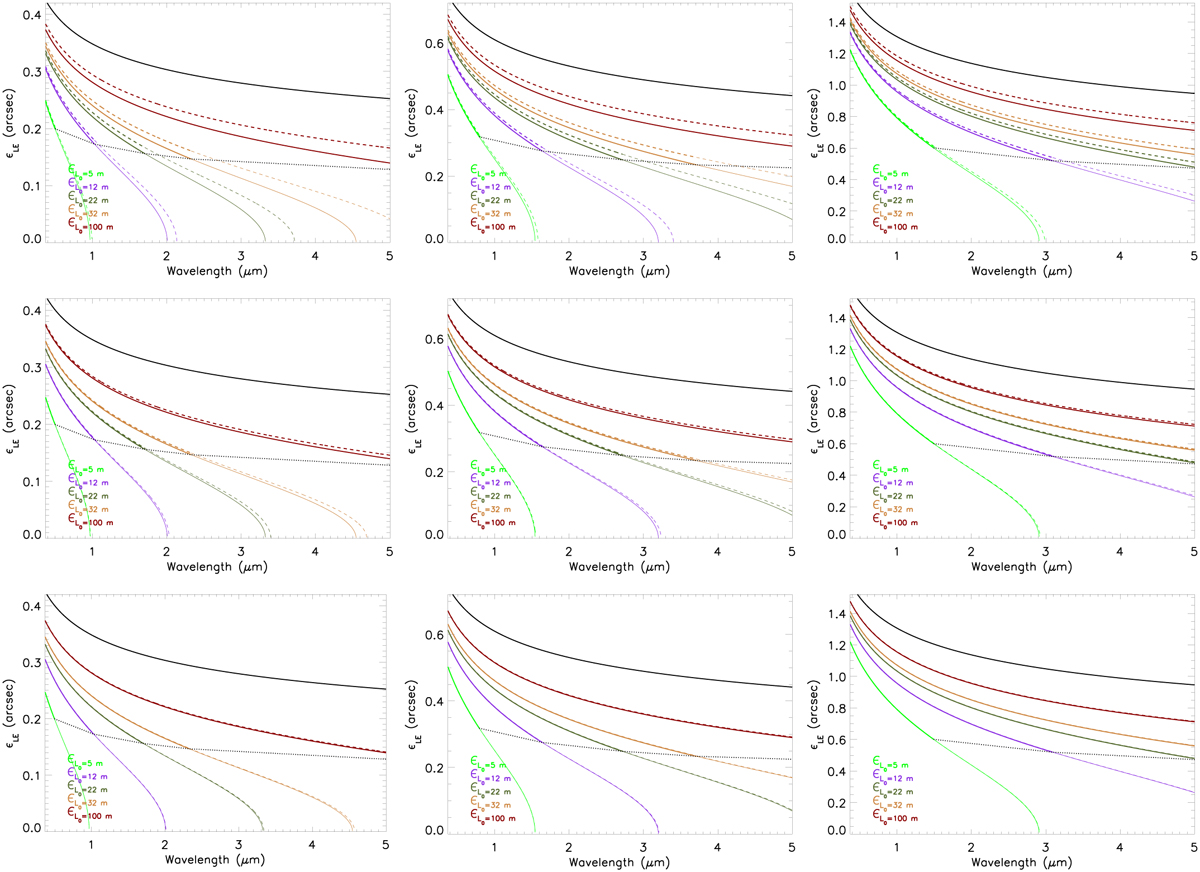
Predicted image quality for a long-exposure image (e.g., λLE) of a point-like source obtained using ground-based telescopes with diameters of 1.5 m (top), 8 m (middle), and 39 m (bottom), as a function of the wavelength. The panels correspond to different λ0 conditions at 5000 Å: 0.4 arcsec (left panels), 0.7 arcsec (central panels), and 1.5 arcsec (right panels). Each curve corresponds to the indicated value of the ![]() of the turbulence in meters:
of the turbulence in meters: ![]() =100 → red,
=100 → red, ![]() =32→ orange,
=32→ orange, ![]() =22 → olive green,
=22 → olive green, ![]() =12 → purple, and
=12 → purple, and ![]() =5 → lime green. The black curve follows the ε0 wavelength dependence (ε0(λ) ∝ λ−1/5), corresponding to
=5 → lime green. The black curve follows the ε0 wavelength dependence (ε0(λ) ∝ λ−1/5), corresponding to ![]() =∞. The solid curves correspond to the first-order approach to εLE following Eq. 5, while the dashed curves to the second-order approach considering the telescope diameter (Eq. 6). The dotted line delineates the
=∞. The solid curves correspond to the first-order approach to εLE following Eq. 5, while the dashed curves to the second-order approach considering the telescope diameter (Eq. 6). The dotted line delineates the ![]() /r0>20 boundary, above which errors are constrained within ±1%.
/r0>20 boundary, above which errors are constrained within ±1%.
Current usage metrics show cumulative count of Article Views (full-text article views including HTML views, PDF and ePub downloads, according to the available data) and Abstracts Views on Vision4Press platform.
Data correspond to usage on the plateform after 2015. The current usage metrics is available 48-96 hours after online publication and is updated daily on week days.
Initial download of the metrics may take a while.