Fig. 3
Download original image
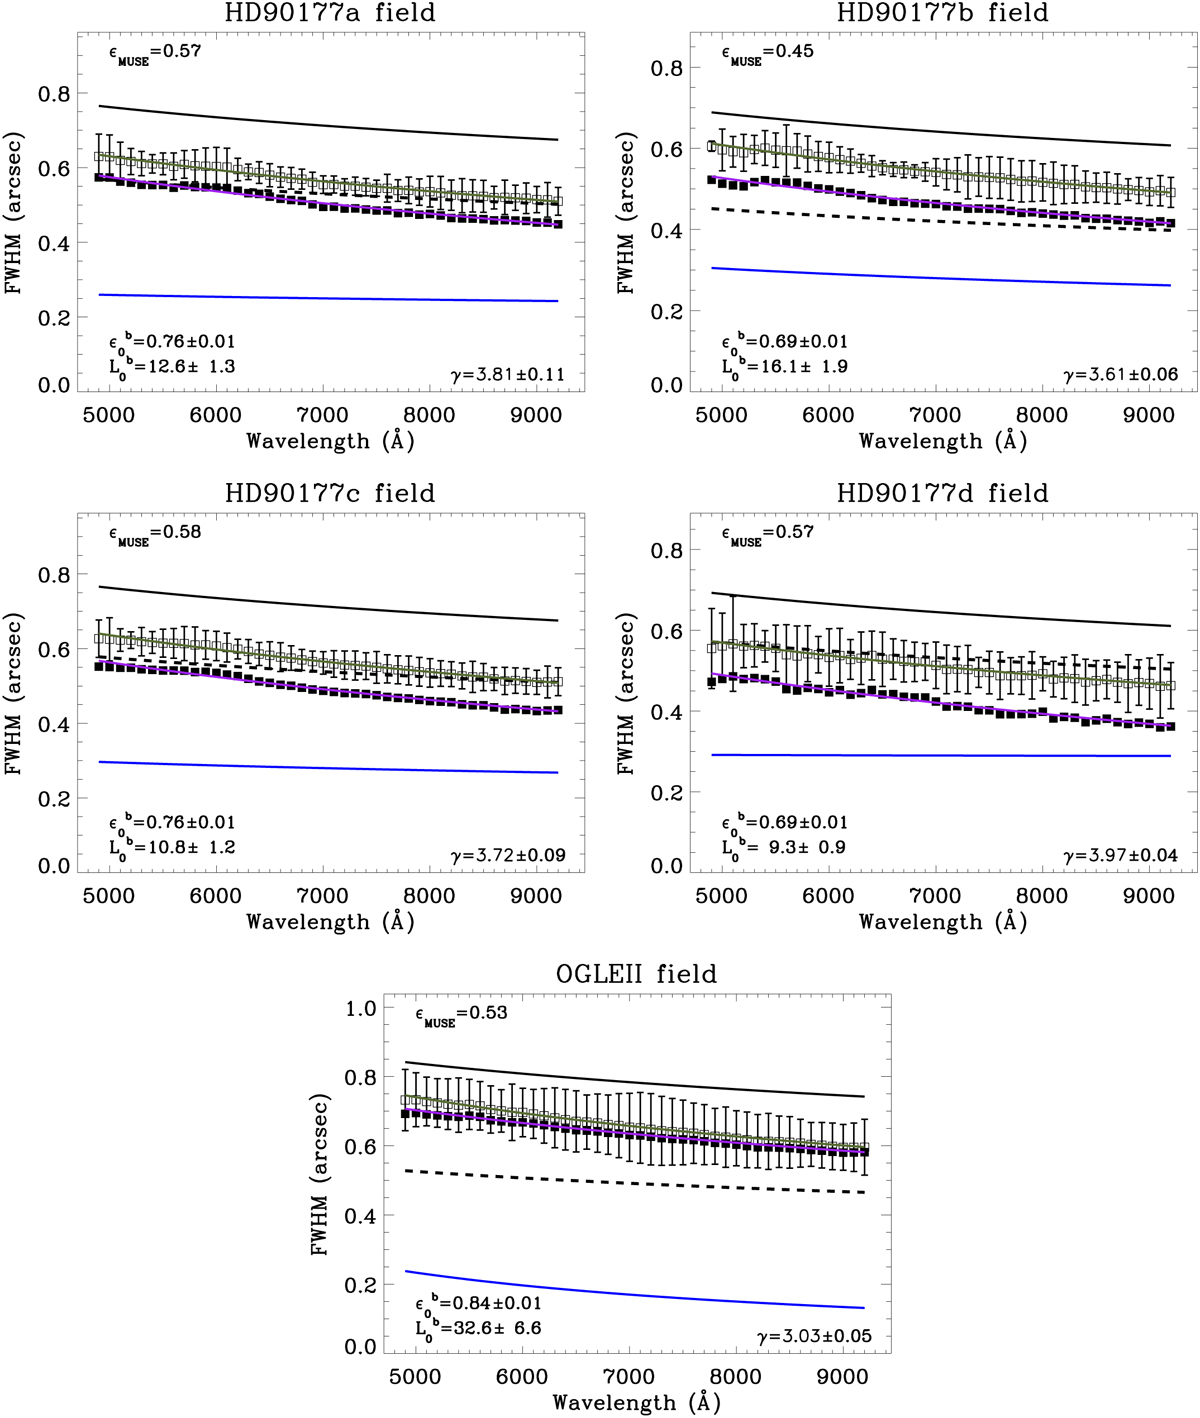
Same as Fig. 2, but considering the dome-turbulence contribution. The black open squares represent the average IQMUSE across each field, as in Fig. 2. The black filled squares show the IQ broadening attributed solely to atmospheric turbulence (i.e., IQMUSE after quadratically subtracting the estimated dome-turbulence contribution at each λ). The blue solid line corresponds to the estimated dome-turbulence contribution, following a power-law dependence on wavelength with the γ-index indicated in the bottom right corner. The green line corresponds to the quadratic sum of the predicted atmospheric (purple line) and dome (blue line) turbulence blur, fitting the measured MUSE IQ.
Current usage metrics show cumulative count of Article Views (full-text article views including HTML views, PDF and ePub downloads, according to the available data) and Abstracts Views on Vision4Press platform.
Data correspond to usage on the plateform after 2015. The current usage metrics is available 48-96 hours after online publication and is updated daily on week days.
Initial download of the metrics may take a while.