Fig. 2
Download original image
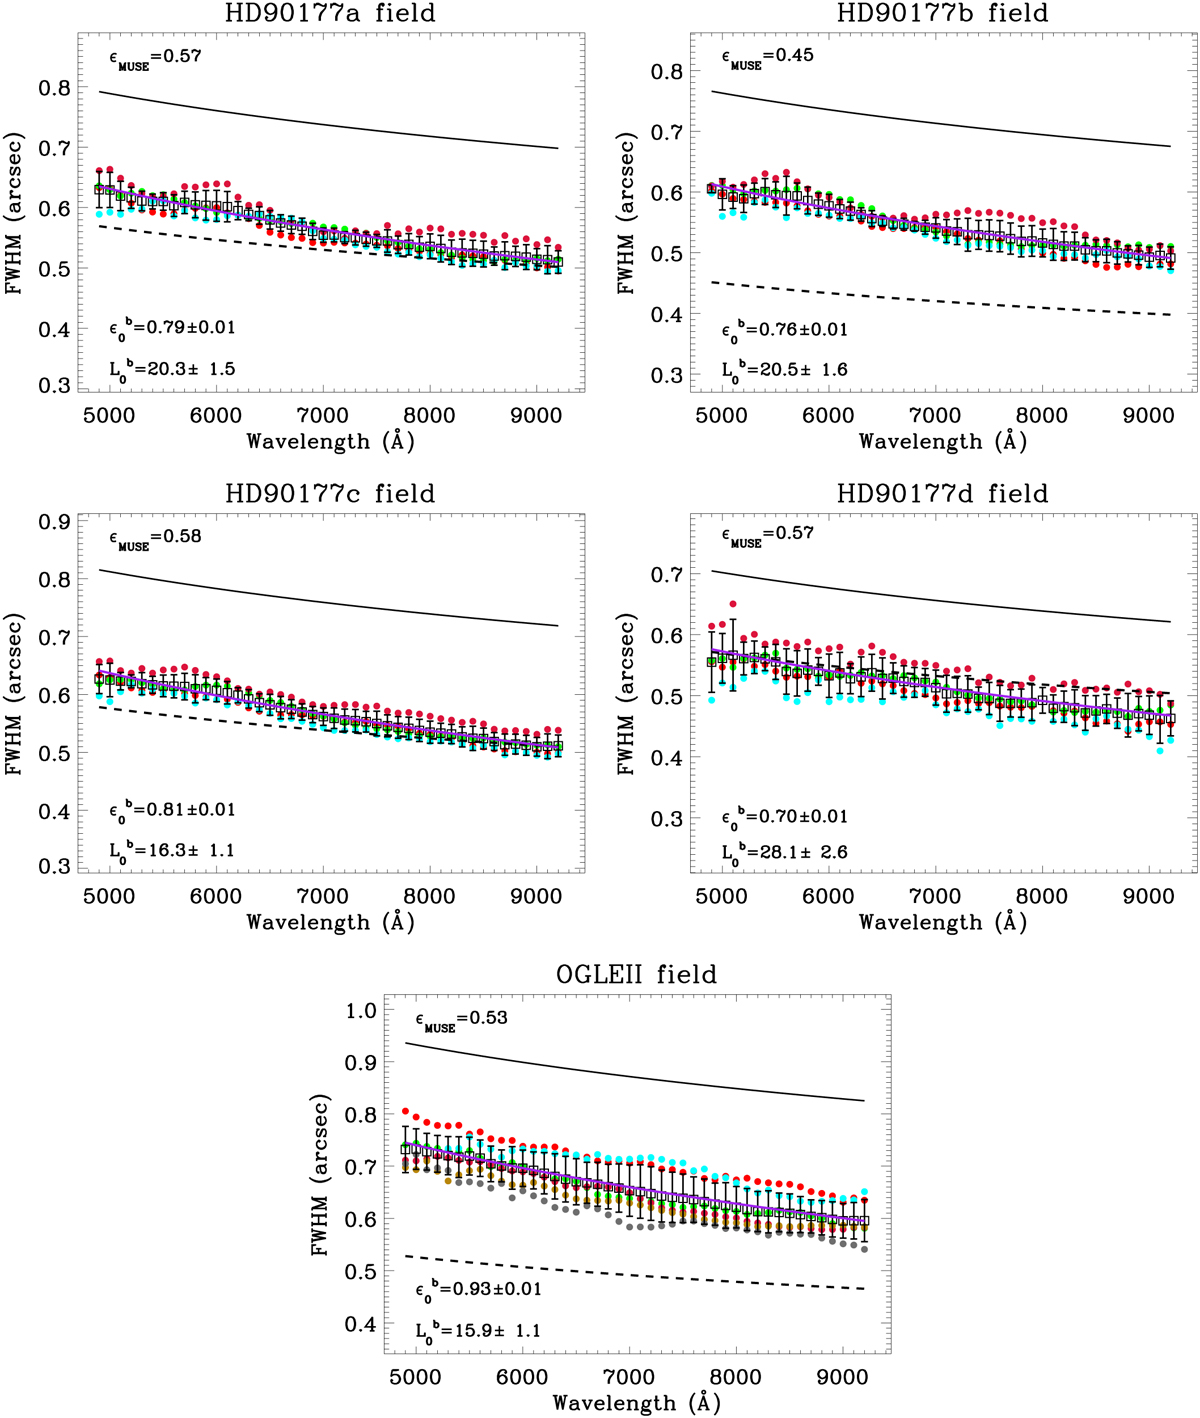
Wavelength dependence of IQ at the MUSE instrument’s focal plane (IQMUSE), analyzed using point-like sources in the MUSE fields indicated in each panel (see Table 2). The colored dots represent IQMUSE values derived from Moffat model fits for 44 band-filter images obtained from distinct stars within each MUSE field (individual plots available in Appendix B.2). The black open squares with error bars denote the average and standard deviation of the measured IQMUSE across all stars at each wavelength. The black dashed line shows the λ−1/5 behavior of the ε0 along the MUSE observation direction (εMUSE in arcseconds, top left corner), derived from average DIMM values during MUSE observations (see Table 2) using Eq. (13). The black solid and purple solid lines represent the ε0 and εLE that best fit the measurements obtained for the parameters ![]() (in arcseconds) and
(in arcseconds) and ![]() (in meters) in the bottom left corner of each plot (details in text).
(in meters) in the bottom left corner of each plot (details in text).
Current usage metrics show cumulative count of Article Views (full-text article views including HTML views, PDF and ePub downloads, according to the available data) and Abstracts Views on Vision4Press platform.
Data correspond to usage on the plateform after 2015. The current usage metrics is available 48-96 hours after online publication and is updated daily on week days.
Initial download of the metrics may take a while.