Fig. B.7
Download original image
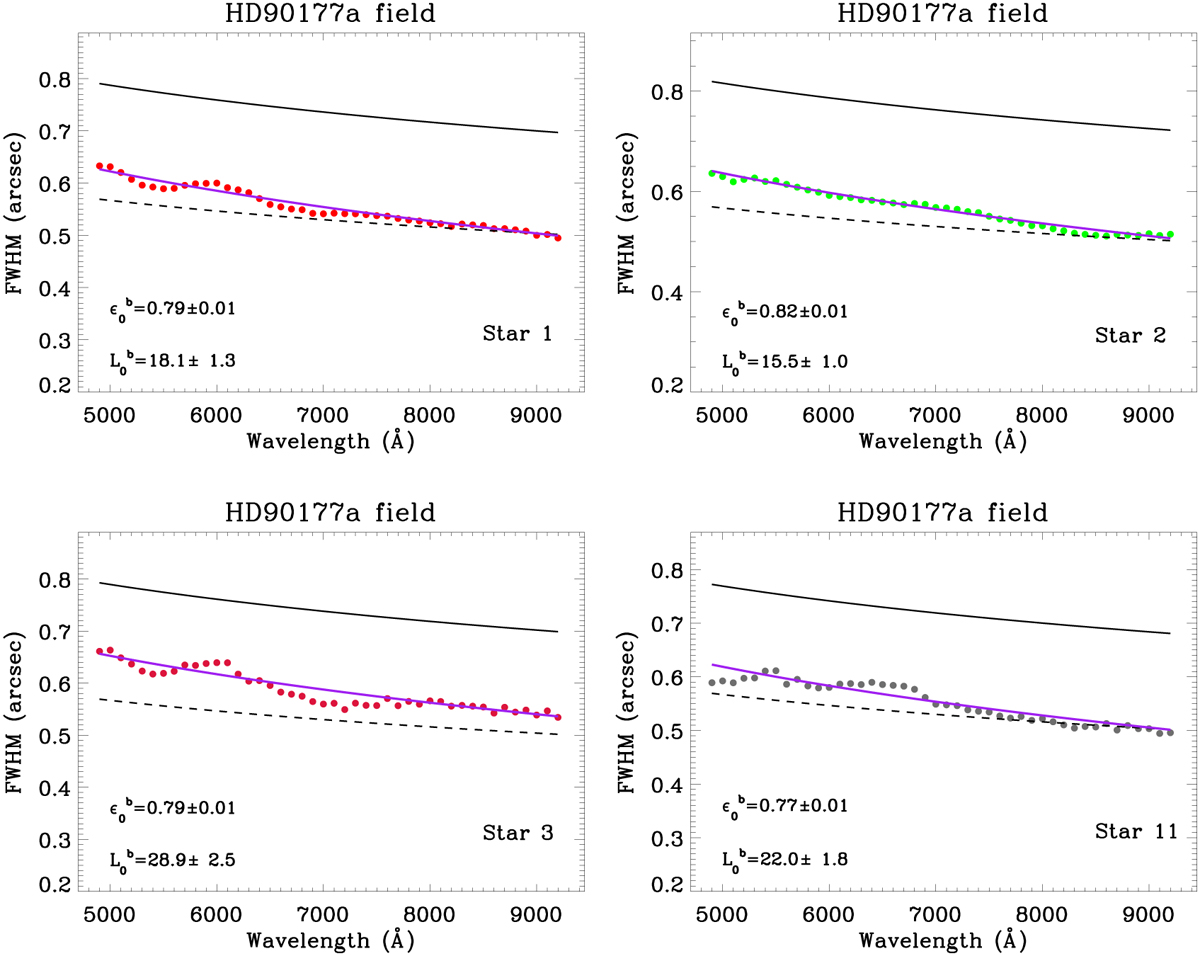
Wavelength variation in the average FWHM for the Moffat fitting profile to the narrowband filter images recovered for each of the selected stars in the MUSE HD90177 field labeled HD90177a (see Fig. B.2, left). The dashed black curve corresponds to the wavelength behavior of the ε0 derived from the average DIMM values during the MUSE observations (see Table 1). The combination of ε0 and ![]() best fitting the observations is indicated in the left corner of each panel; the values were obtained by minimizing the residuals, while varying ε0 and
best fitting the observations is indicated in the left corner of each panel; the values were obtained by minimizing the residuals, while varying ε0 and ![]() values. The purple line corresponds to the wavelength εLE variation using
values. The purple line corresponds to the wavelength εLE variation using ![]() and
and ![]() b. The black solid line represents the λ−1/5 behaviour using
b. The black solid line represents the λ−1/5 behaviour using ![]() .
.
Current usage metrics show cumulative count of Article Views (full-text article views including HTML views, PDF and ePub downloads, according to the available data) and Abstracts Views on Vision4Press platform.
Data correspond to usage on the plateform after 2015. The current usage metrics is available 48-96 hours after online publication and is updated daily on week days.
Initial download of the metrics may take a while.