Fig. 4
Download original image
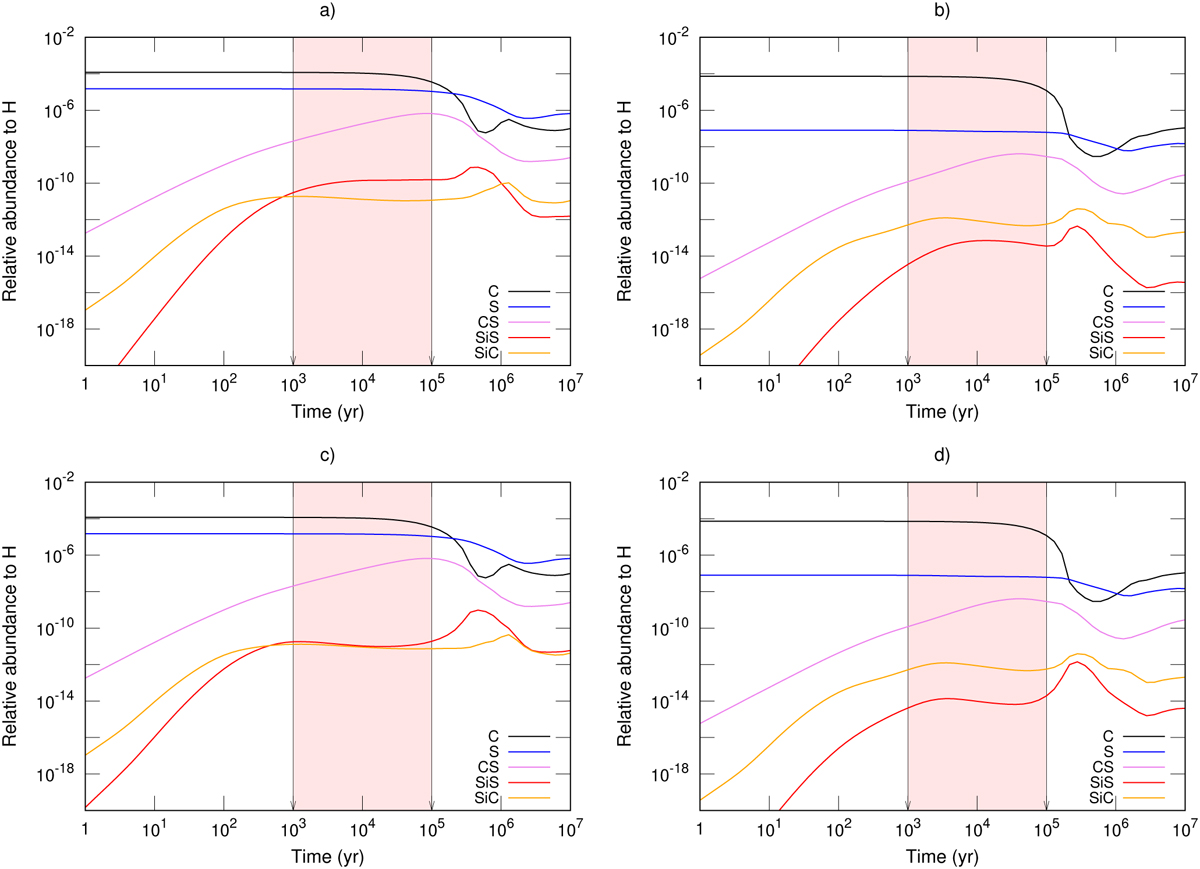
Time evolution of abundances of C, S, CS, SiS, and SiC, shown in black, blue, magenta, red, and yellow, respectively. Panels a and b illustrate simulations with high- and low-metallicity values, respectively, using the default network of chemical reactions. Panels c and d represent high- and low-metallicity models, respectively, incorporating the newly computed chemical reactions in this work (see Table 2). The interval indicated by the arrows, between 103–105 yr, signifies an early stage of relative stabilisation in the SiS abundance (see Sect 4.1).
Current usage metrics show cumulative count of Article Views (full-text article views including HTML views, PDF and ePub downloads, according to the available data) and Abstracts Views on Vision4Press platform.
Data correspond to usage on the plateform after 2015. The current usage metrics is available 48-96 hours after online publication and is updated daily on week days.
Initial download of the metrics may take a while.