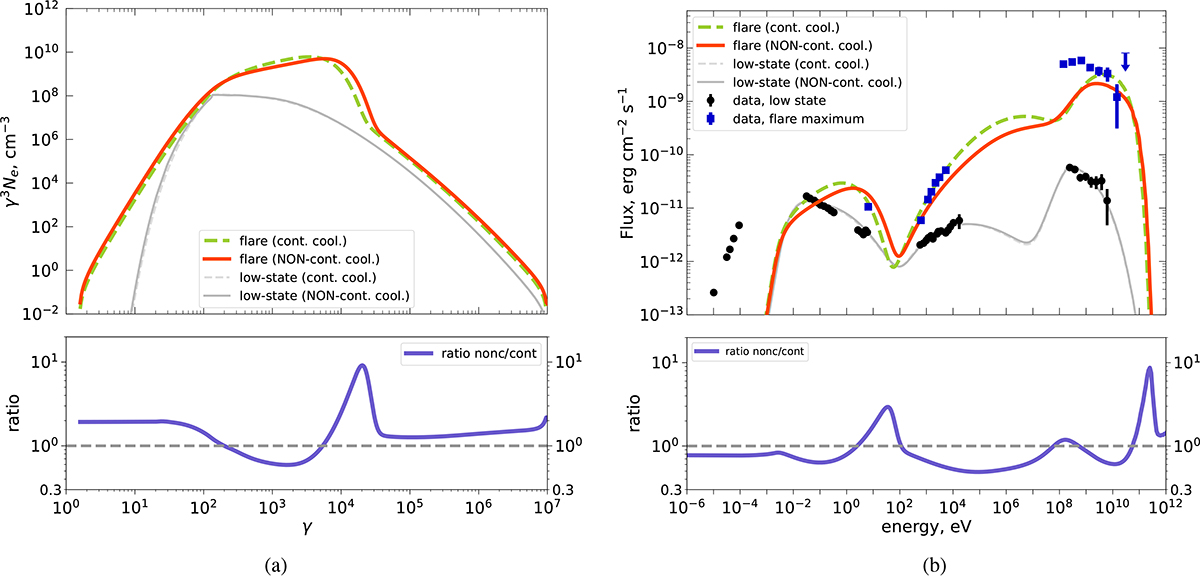
Fig. 3.
Download original image
Comparison of the electron spectrum (left) and the associated SED (right) between two cooling descriptions for the peak of the June 2015 flaring state of 3C 279. The electron spectra here are again shown in γ3Ne(γ) representation. The bottom panel of the electron spectrum–SED plot displays the ratio between the electron spectra–SEDs in the case of non-continuous cooling (orange solid curves) and the continuous-loss approximation (green dashed curves) in linear scale.
Current usage metrics show cumulative count of Article Views (full-text article views including HTML views, PDF and ePub downloads, according to the available data) and Abstracts Views on Vision4Press platform.
Data correspond to usage on the plateform after 2015. The current usage metrics is available 48-96 hours after online publication and is updated daily on week days.
Initial download of the metrics may take a while.