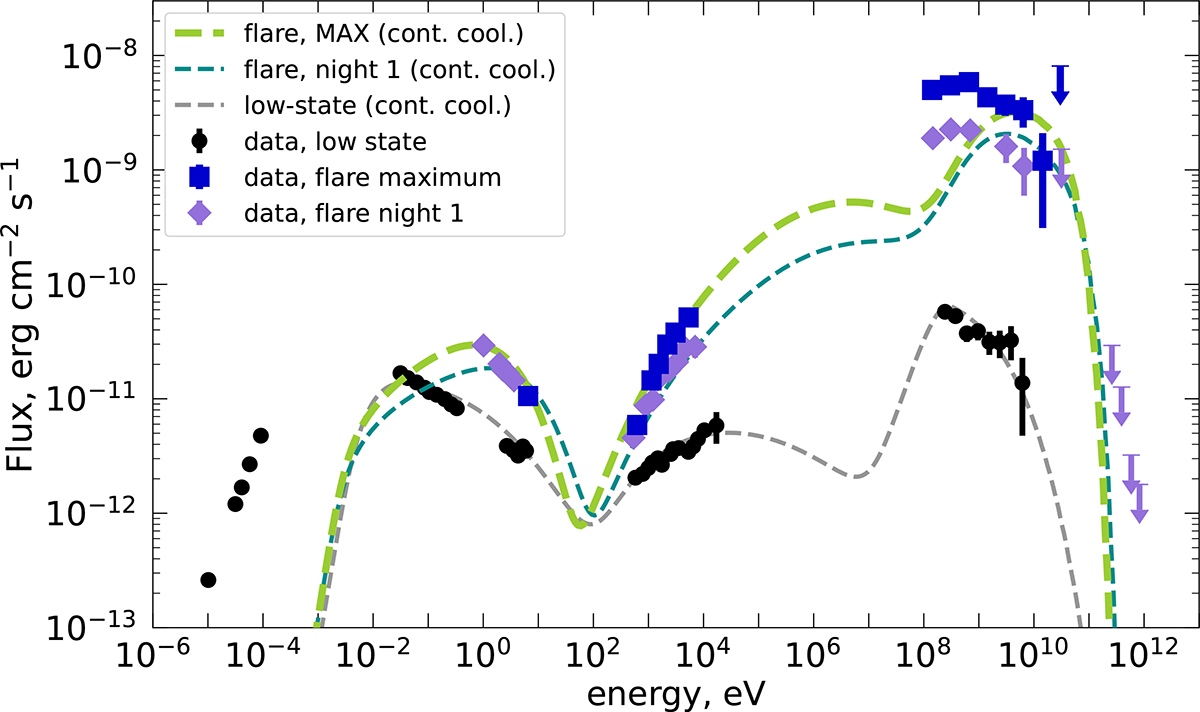
Fig. 2.
Download original image
Modelling of the June 2015 flaring state of 3C 279. The black, blue, and purple data points display the MWL data during the low state, flare peak, and in the pre-peak state of ‘Night 1’ (≈8.9 h earlier), respectively (H. E. S. S. Collaboration 2019). The data points at the highest energies are uncorrected for the extragalactic background light (EBL) absorption. The error bars for the optical and X-ray data points are relatively small and are not visible. The grey curve shows the low-state model from Fig. 1, the cyan curve indicates the time-dependent flare model at the moment t1 = 3.6 Rb/c, fitting the pre-peak state data, and the green curve illustrates the same model at the moment t2 = 12.8 Rb/c, fitting the flare peak data. The model SEDs were absorbed on the EBL using the model by Domínguez et al. (2011). The model curves are displayed in the dashed style to highlight the use of the continuous-loss approximation in the model calculation.
Current usage metrics show cumulative count of Article Views (full-text article views including HTML views, PDF and ePub downloads, according to the available data) and Abstracts Views on Vision4Press platform.
Data correspond to usage on the plateform after 2015. The current usage metrics is available 48-96 hours after online publication and is updated daily on week days.
Initial download of the metrics may take a while.