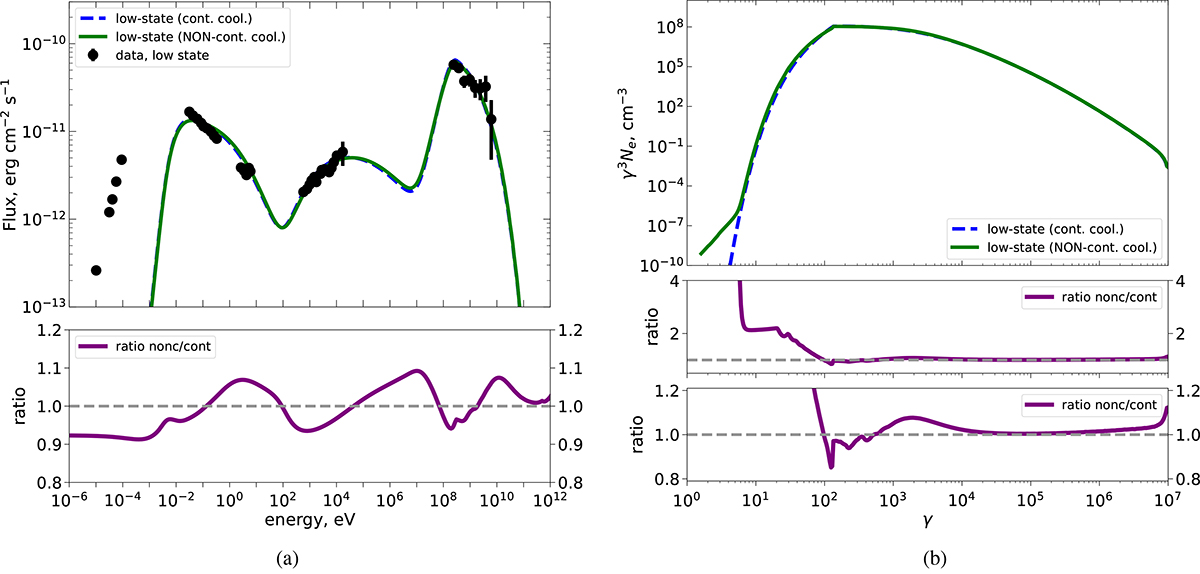
Fig. 1.
Download original image
Comparison of the low-state SEDs and electron spectra for the two cooling descriptions. The blue dashed curves represent the model with continuous-loss approximation for cooling (Moderski et al. 2005), whereas green solid curves indicate the same model, but with the full non-continuous cooling term. Left panel: modelling of the low-state SED of 3C 279. The black points display the low-state data set of the source (Hayashida et al. 2012). The adjacent narrow bottom panel provides a zoom onto the SED ratio of the non-continuous to continuous-loss cooling description (in linear scale). Right panel: underlying low-state electron spectra for the two cooling descriptions. The electron spectra are shown in γ3Ne(γ) representation to better highlight the discrepancies between the two cooling models. Adjacent narrow bottom panels show the ratio of the electron spectrum between the non-continuous and continuous-loss cooling scenarios (in linear scale), with the second lower panel showing a zoom onto the Lorentz factor domain above 100.
Current usage metrics show cumulative count of Article Views (full-text article views including HTML views, PDF and ePub downloads, according to the available data) and Abstracts Views on Vision4Press platform.
Data correspond to usage on the plateform after 2015. The current usage metrics is available 48-96 hours after online publication and is updated daily on week days.
Initial download of the metrics may take a while.