Open Access
Fig. 6.
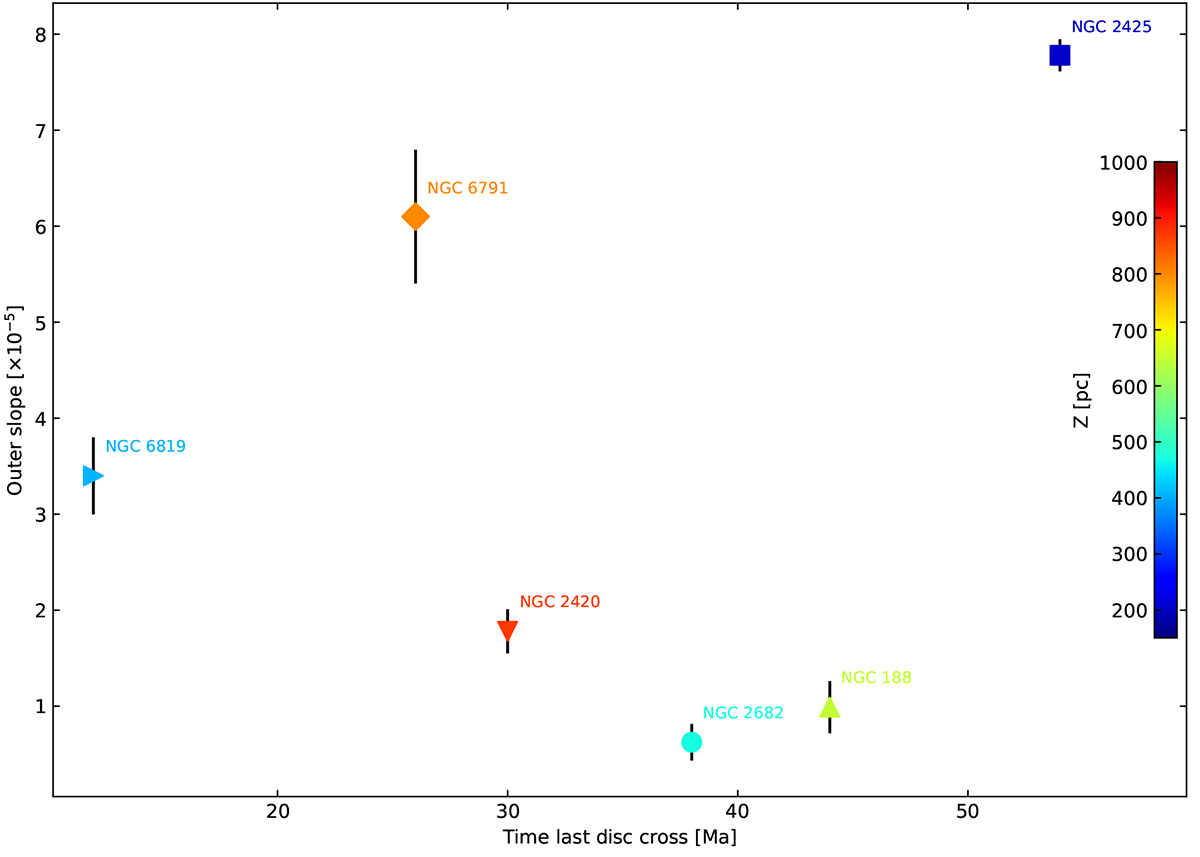
Download original image
Slope of the outermost region of the radial density profile as a function of the last time the clusters crossed the disc. The clusters are colour coded as a function of their actual distance to the Galactic plane and the same symbols are used as in previous figures.
Current usage metrics show cumulative count of Article Views (full-text article views including HTML views, PDF and ePub downloads, according to the available data) and Abstracts Views on Vision4Press platform.
Data correspond to usage on the plateform after 2015. The current usage metrics is available 48-96 hours after online publication and is updated daily on week days.
Initial download of the metrics may take a while.