Open Access
Fig. 5.
Download original image
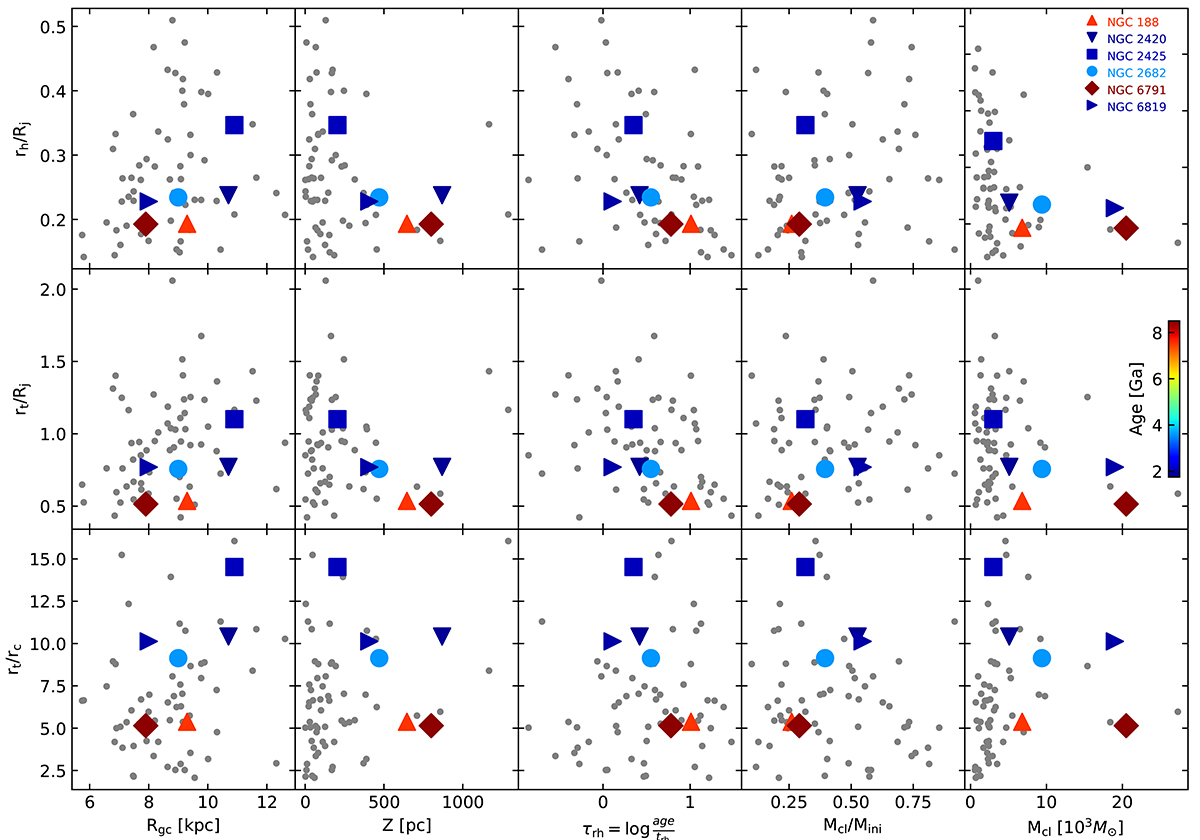
rh/RJ (top), rt/RJ (middle), and rt/rc (bottom) as a function of Rgc, Z, τrh, Mcl/Mini, and cluster mass. The clusters studied here are labelled with different colours as a function of age, and are marked with symbols to facilitate their identification. Grey dots are the clusters studied by Angelo et al. (2023).
Current usage metrics show cumulative count of Article Views (full-text article views including HTML views, PDF and ePub downloads, according to the available data) and Abstracts Views on Vision4Press platform.
Data correspond to usage on the plateform after 2015. The current usage metrics is available 48-96 hours after online publication and is updated daily on week days.
Initial download of the metrics may take a while.