Fig. 2.
Download original image
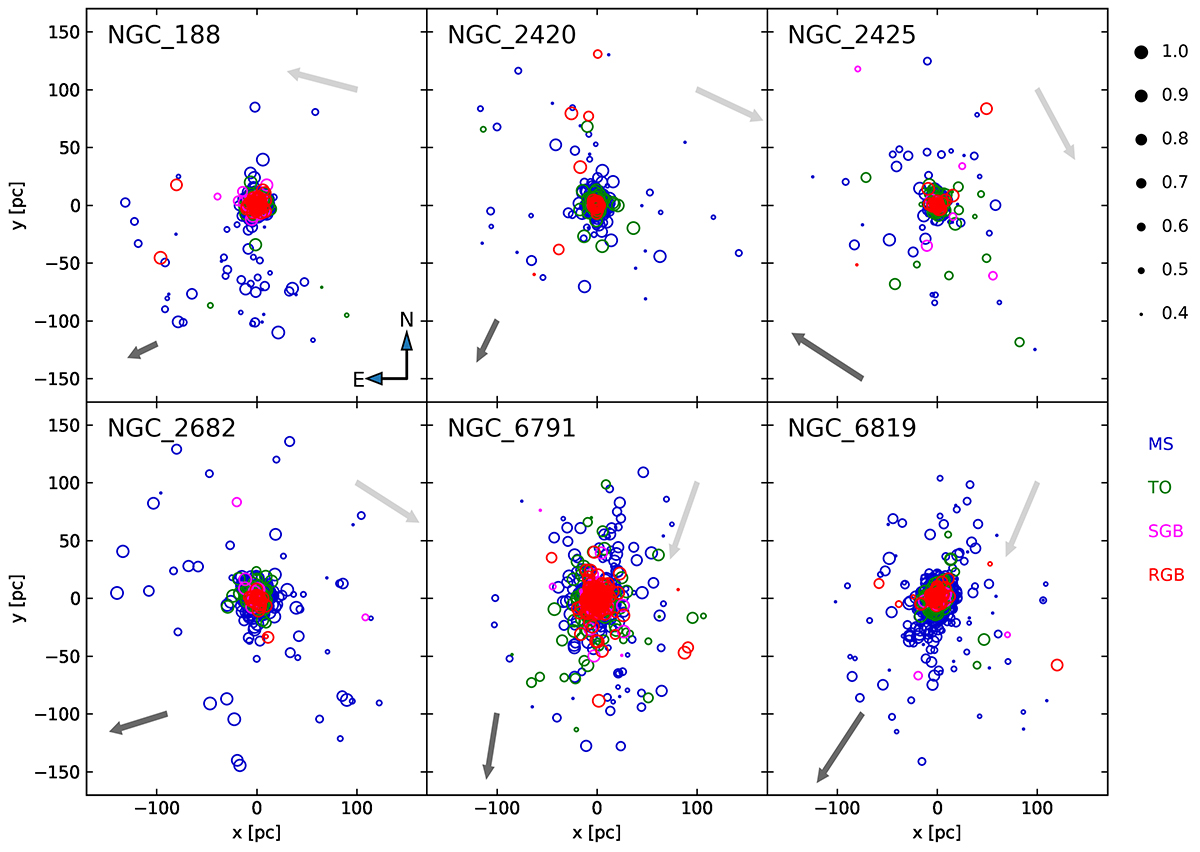
Spatial distribution in Cartesian coordinates (x, y) of the studied cluster. The size of the points is proportional to the astrometric membership probability. The different populations are colour coded as in Fig. 1, excluding the binaries and BSSs for clarity. The dark grey arrows in the bottom left corner show the direction of motion and their length is proportional to the velocity in each axis. The light grey arrows in the top right corner show the direction to the Galactic centre.
Current usage metrics show cumulative count of Article Views (full-text article views including HTML views, PDF and ePub downloads, according to the available data) and Abstracts Views on Vision4Press platform.
Data correspond to usage on the plateform after 2015. The current usage metrics is available 48-96 hours after online publication and is updated daily on week days.
Initial download of the metrics may take a while.