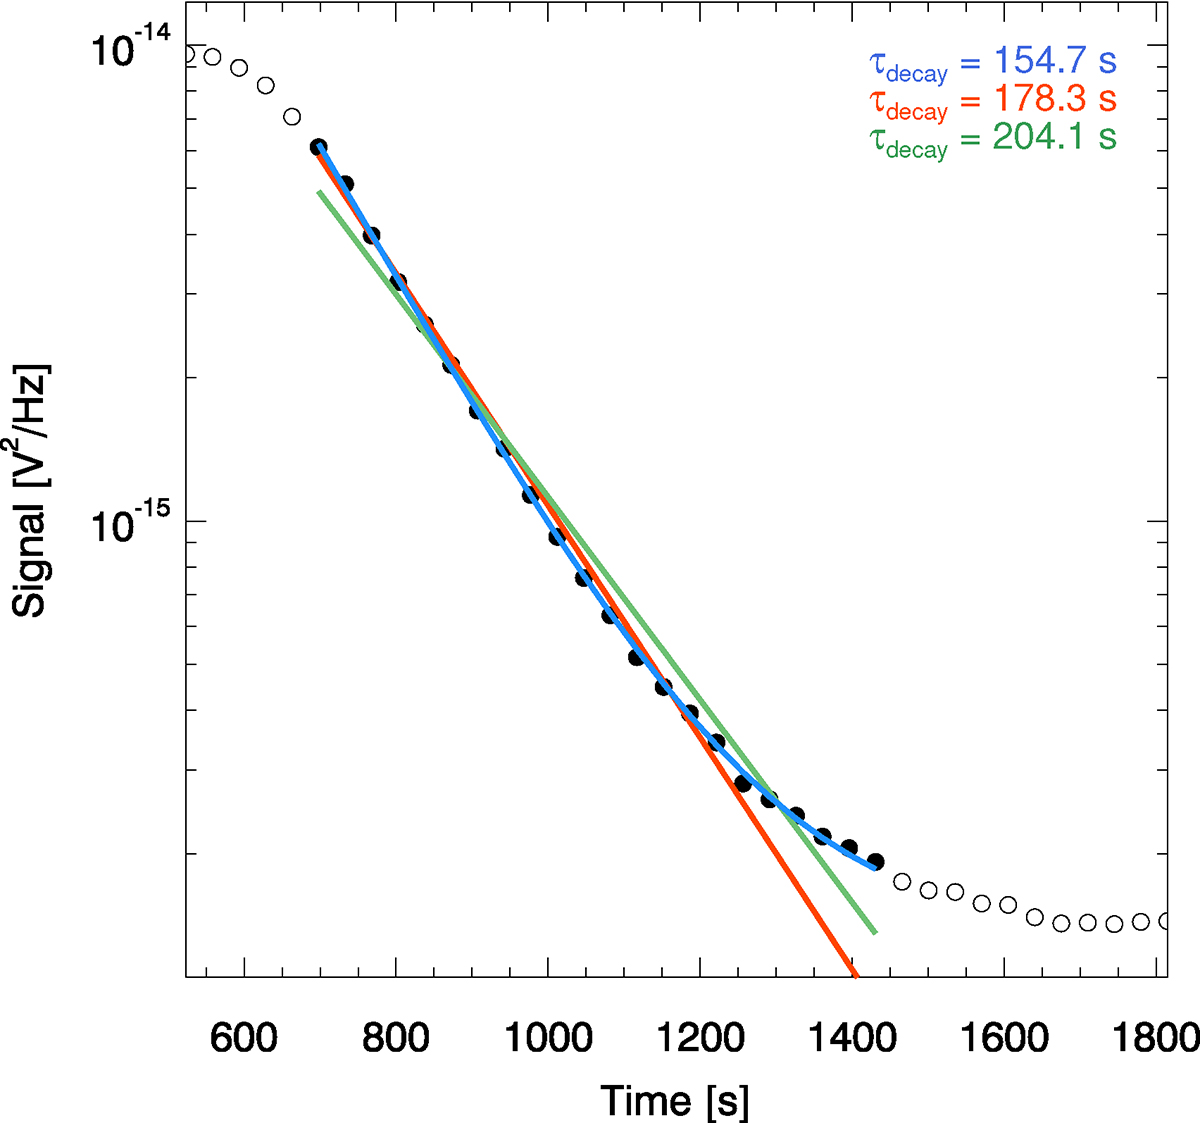
Fig. C.2.
Download original image
Comparisons of single-exponential fit outputs for 3 differing user choices. The orange fit is obtained by fitting the data using Eq. (1), as in the top right panel of Fig. C.1. The green fit is obtained by linearising the data before fitting it with the linearised form of Eq. (1). The blue curve was obtained by fitting the data with a variant of Eq. (1) that includes the addition of a constant offset as a fit parameter. The corresponding estimated decay times are indicated in the legend, highlighting the significant variation arising from these user choices. The data was recorded by STA at 325 kHz around 17:50 UT on 18-Nov-2020.
Current usage metrics show cumulative count of Article Views (full-text article views including HTML views, PDF and ePub downloads, according to the available data) and Abstracts Views on Vision4Press platform.
Data correspond to usage on the plateform after 2015. The current usage metrics is available 48-96 hours after online publication and is updated daily on week days.
Initial download of the metrics may take a while.