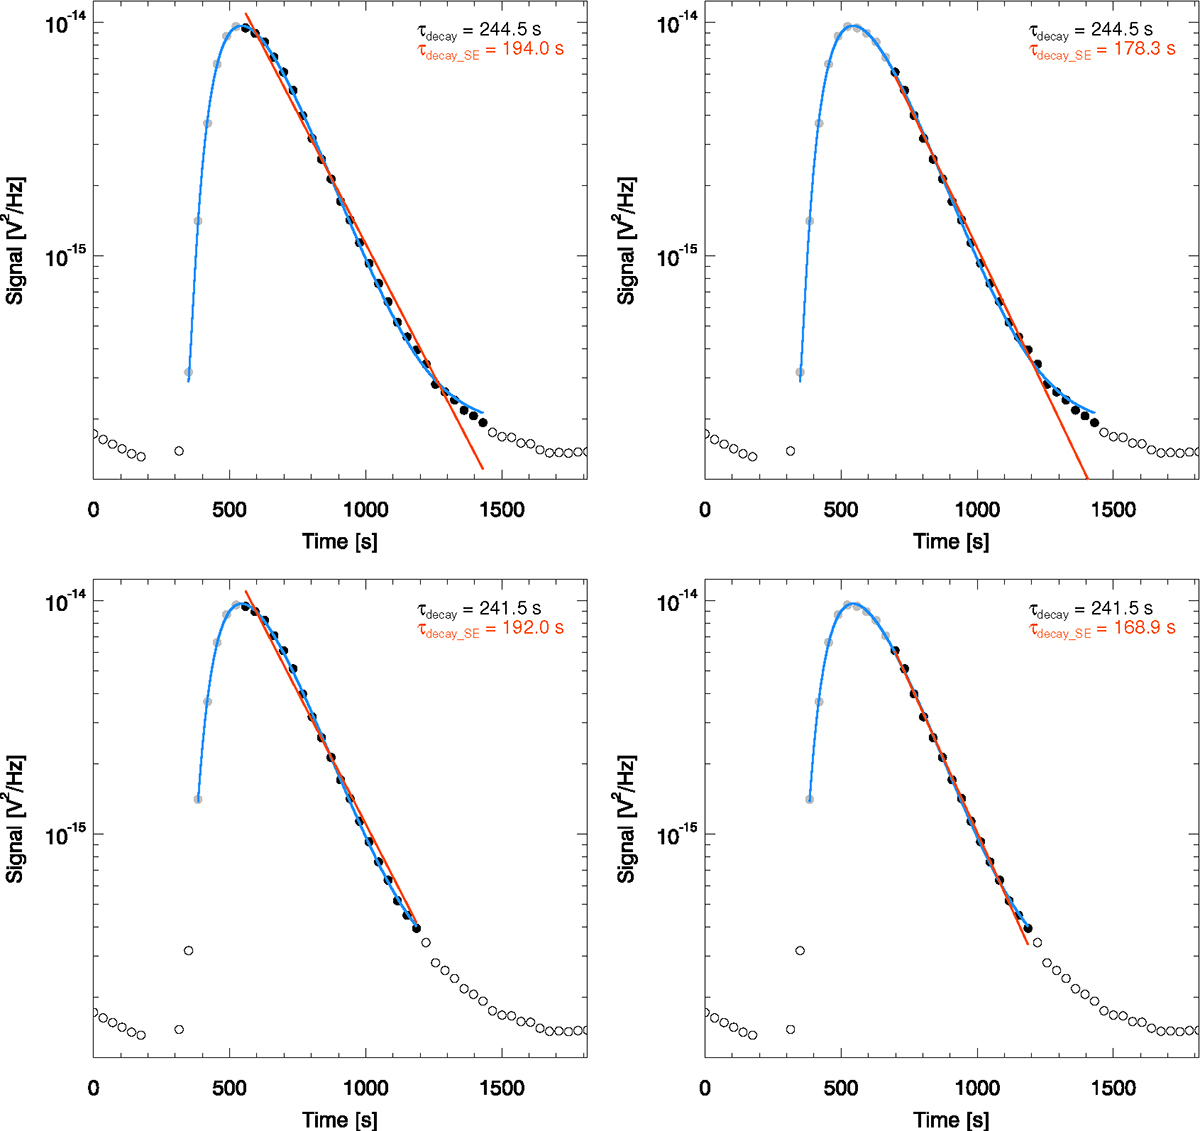
Fig. C.1.
Download original image
Comparisons of the proposed function (Eq. (2)) and the single-exponential function (Eq. (1)), using 4 different combinations of user-defined fit conditions (detailed in the text). The corresponding decay times obtained from the proposed and single-exponential (SE) fits are indicated in the legend. Top row: Fitting only the signals ≥2% of the peak amplitude. Bottom row: Fitting only the signals ≥4% of the peak amplitude. Left column: Excluding the peak-amplitude data point from the single-exponential fit. Right column: Excluding the first 5 data points after the peak time from the single-exponential fit, ignoring the initial part of the decay phase where it appears to be non-exponential. Filled, grey circles indicate the data points considered when fitting using the proposed function (blue curve). Filled, black circles indicate the data points considered for the single-exponential fit (orange line). The legend of each panel depicts the estimated decay time from both the proposed fit (in black) and the single exponential fit (in orange). The data was recorded by STA at 325 kHz around 17:50 UT on 18-Nov-2020, as shown in Fig. 2a.
Current usage metrics show cumulative count of Article Views (full-text article views including HTML views, PDF and ePub downloads, according to the available data) and Abstracts Views on Vision4Press platform.
Data correspond to usage on the plateform after 2015. The current usage metrics is available 48-96 hours after online publication and is updated daily on week days.
Initial download of the metrics may take a while.