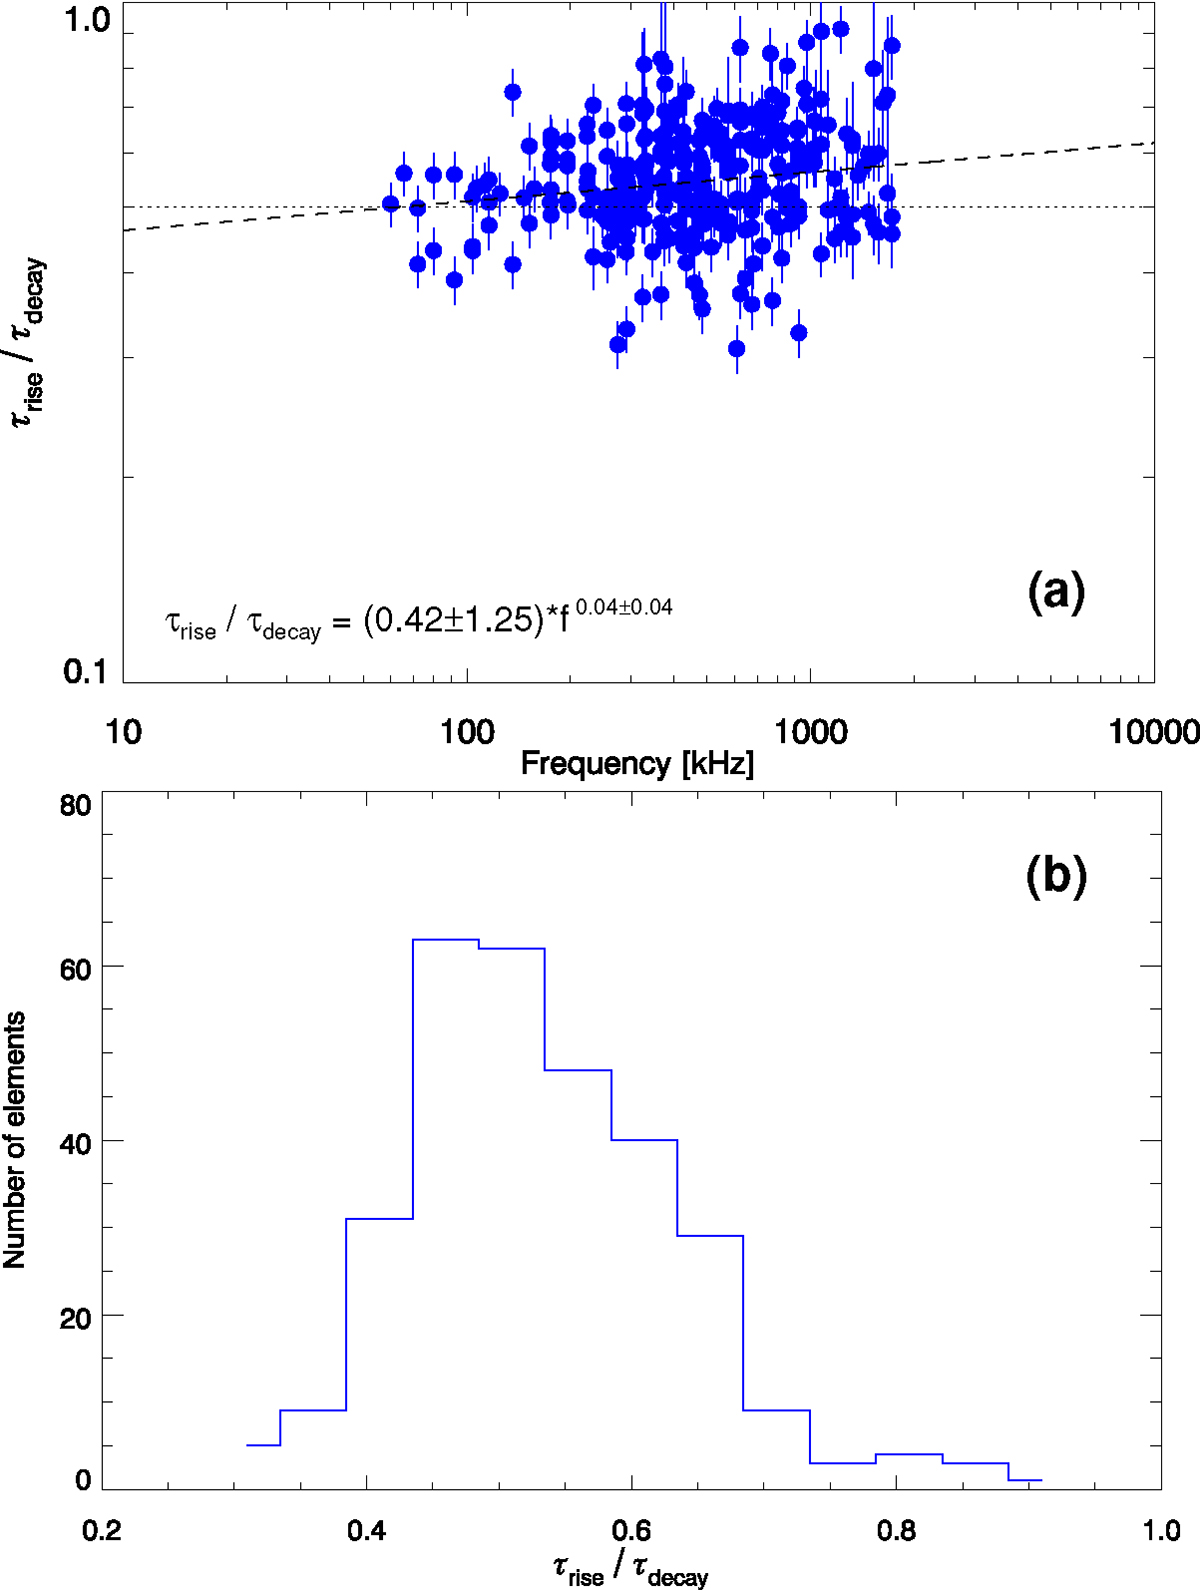
Fig. 5.
Download original image
Rise-to-decay time ratios obtained from 307 light curves with frequencies ranging from 60 to 1725 kHz. (a) Ratios (and associated uncertainties) of rise-to-decay times with respect to frequency. The rise and decay times were calculated at the Smax/e level using Eq. (2). The dashed black line represents the weighted linear fit to the data, with the obtained relation stated at the bottom of the panel. The dotted black line indicates the level at which the ratio is equal to 0.5. (b) Histogram of the calculated rise-to-decay time ratios. The median value is ∼0.54 (and the average value is ∼0.56).
Current usage metrics show cumulative count of Article Views (full-text article views including HTML views, PDF and ePub downloads, according to the available data) and Abstracts Views on Vision4Press platform.
Data correspond to usage on the plateform after 2015. The current usage metrics is available 48-96 hours after online publication and is updated daily on week days.
Initial download of the metrics may take a while.