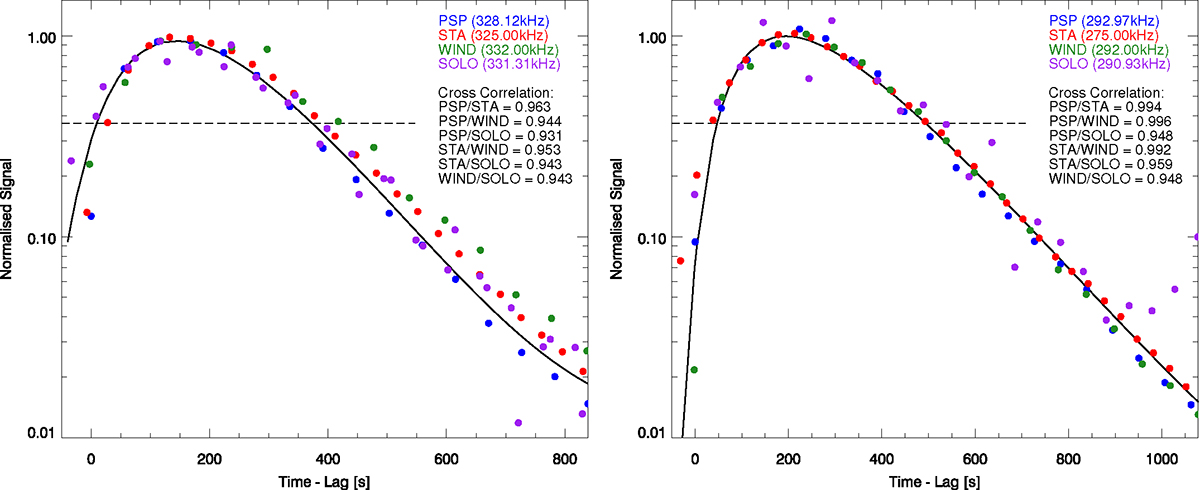
Fig. 4.
Download original image
Aligned light curves recorded by four different spacecraft at comparable frequencies for two separate Type III bursts (shown in each of the panels). The light curves were normalised based on their maximum amplitude obtained by fitting, hence the peak data points may appear below or above unity (Appendix J). The calculated cross-correlation values between each of the light curves are displayed in the panel legends. The dashed black line illustrates the Smax/e level at which the decay and rise times are estimated. The black curve is a visual guide, based on applying Eq. (2) to all recorded light curves of each event simultaneously. The depicted events were recorded on 18 November 2020 (left) and 16 July 2021 (right).
Current usage metrics show cumulative count of Article Views (full-text article views including HTML views, PDF and ePub downloads, according to the available data) and Abstracts Views on Vision4Press platform.
Data correspond to usage on the plateform after 2015. The current usage metrics is available 48-96 hours after online publication and is updated daily on week days.
Initial download of the metrics may take a while.