Open Access
Fig. 2.
Download original image
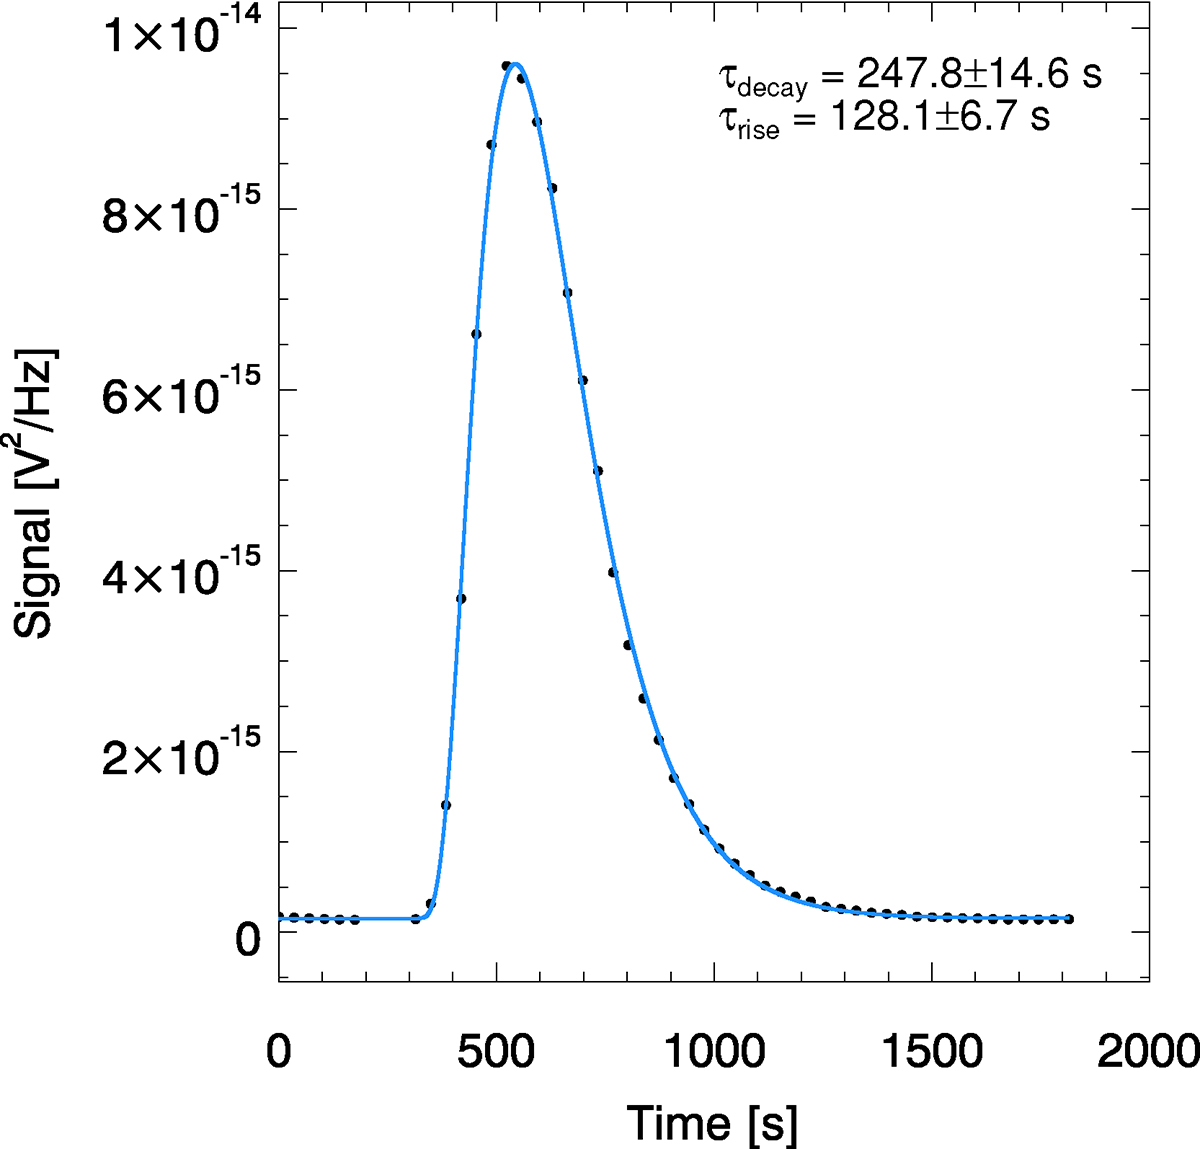
Single fit of the entire light curve. The blue curve is the fit, and the black points are measurements of a Type III solar radio burst recorded by STA at 325 kHz around 17:50 UT on 18 November 2020. The inferred decay and rise times and their associated errors are indicated in the legend.
Current usage metrics show cumulative count of Article Views (full-text article views including HTML views, PDF and ePub downloads, according to the available data) and Abstracts Views on Vision4Press platform.
Data correspond to usage on the plateform after 2015. The current usage metrics is available 48-96 hours after online publication and is updated daily on week days.
Initial download of the metrics may take a while.