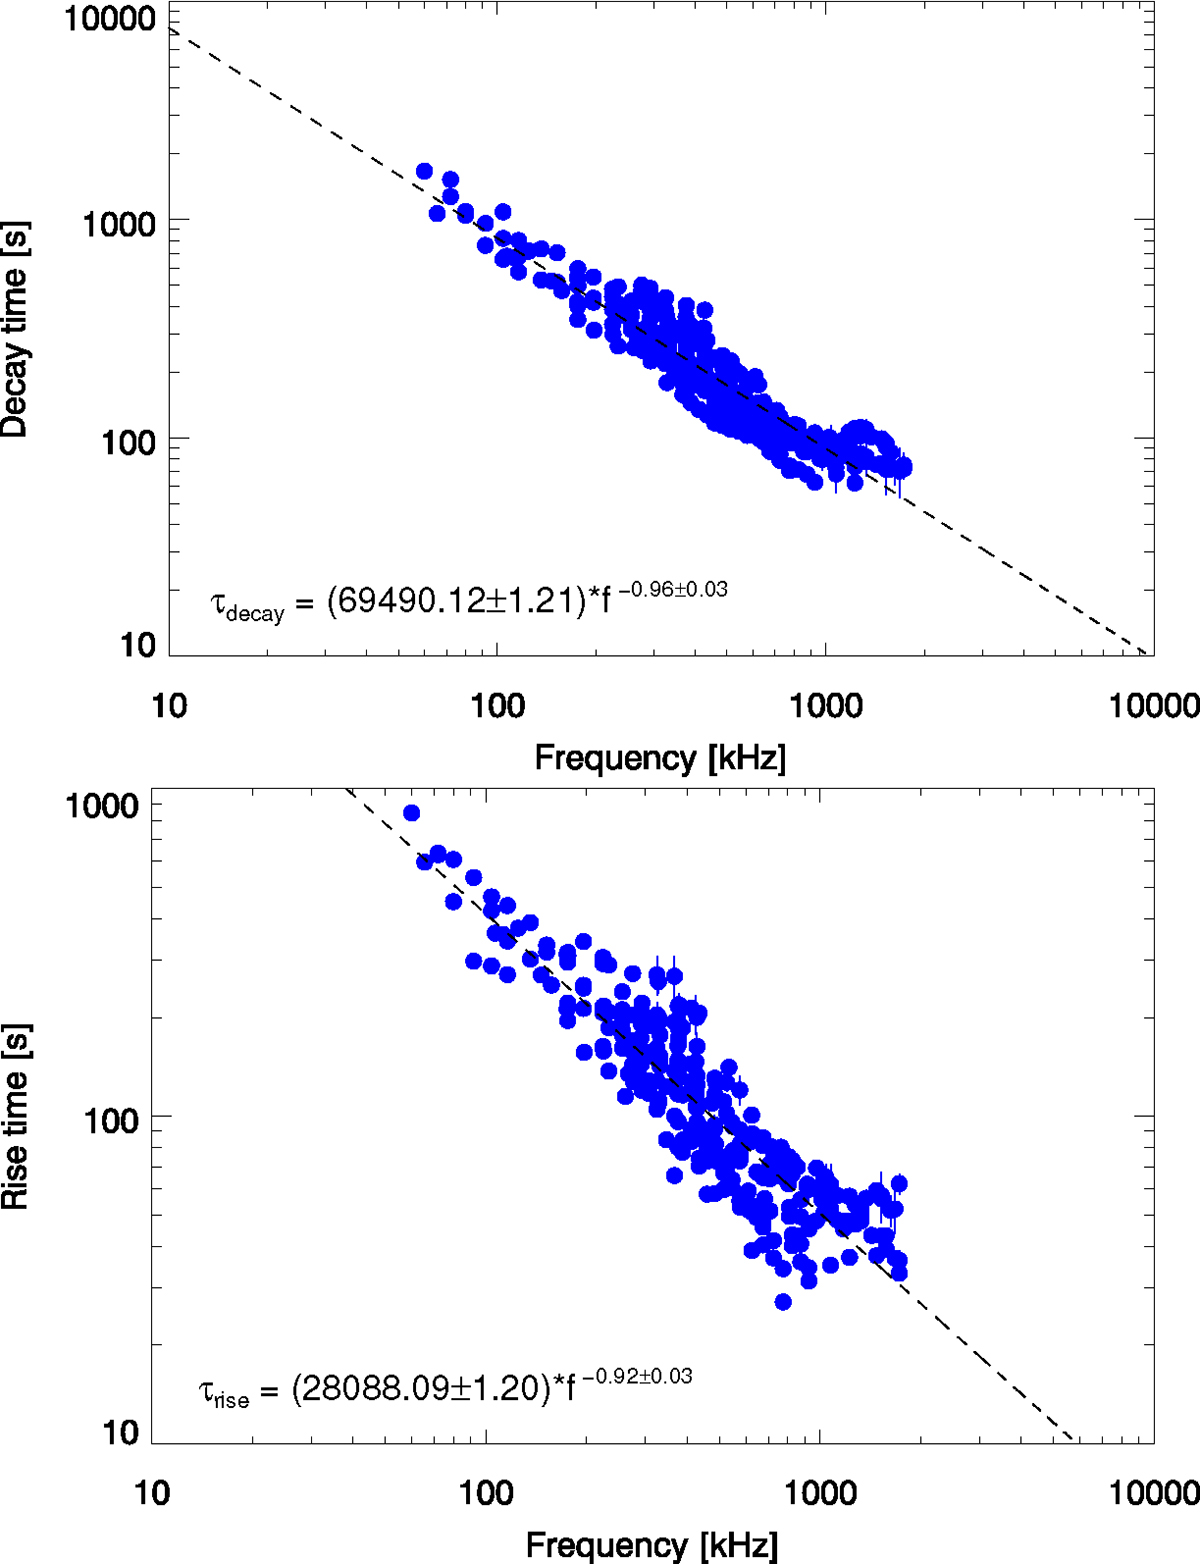
Fig. K.1.
Download original image
Decay times (top) and rise times (bottom) as a function of frequency, for 307 measurements at frequencies ranging from 60–1725 kHz, obtained from the Type III bursts listed in Table A.1. The values and their uncertainties were calculated at the Smax/e level as described in Sect. 3.1. The dashed black lines represent the weighted linear fit to the data, whose exact form is shown on the bottom left of each panel. It should be noted that the frequencies shown here (and thus reflected in the obtained relations) are given in kHz.
Current usage metrics show cumulative count of Article Views (full-text article views including HTML views, PDF and ePub downloads, according to the available data) and Abstracts Views on Vision4Press platform.
Data correspond to usage on the plateform after 2015. The current usage metrics is available 48-96 hours after online publication and is updated daily on week days.
Initial download of the metrics may take a while.