Fig. I.1.
Download original image
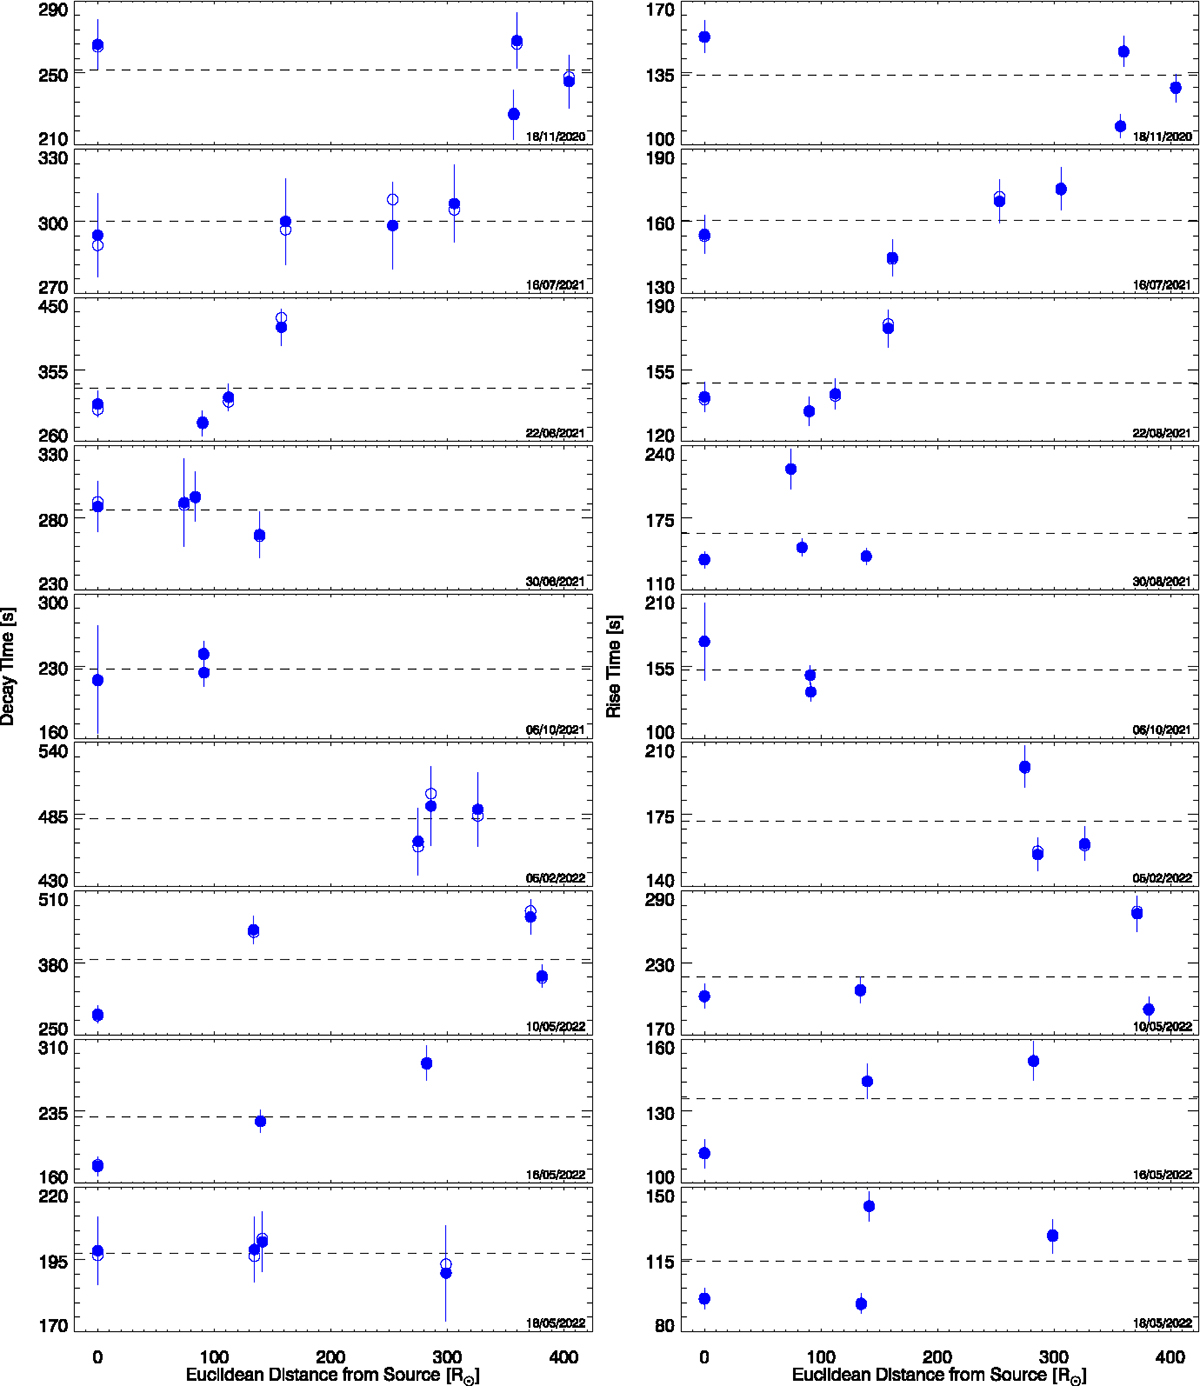
Observed decay times (left) and rise times (right), with their associated errors, as a function of the Euclidean distance of the spacecraft from the source. Each row represents one Type III burst, and the spacecraft that recorded the Langmuir waves in situ is always located at 0 R⊙. The dotted black line in each panel represents the average decay- (rise-) time value measured for the given event. Empty circles represent the decay (rise) times obtained by fitting Eq. (2), whereas filled circles represent the same measurements, but corrected for the systematic offset induced by any difference in the recorded frequencies between spacecraft (Appendix G). For clarity, error bars are only plotted for the filled circles.
Current usage metrics show cumulative count of Article Views (full-text article views including HTML views, PDF and ePub downloads, according to the available data) and Abstracts Views on Vision4Press platform.
Data correspond to usage on the plateform after 2015. The current usage metrics is available 48-96 hours after online publication and is updated daily on week days.
Initial download of the metrics may take a while.