Fig. 1.
Download original image
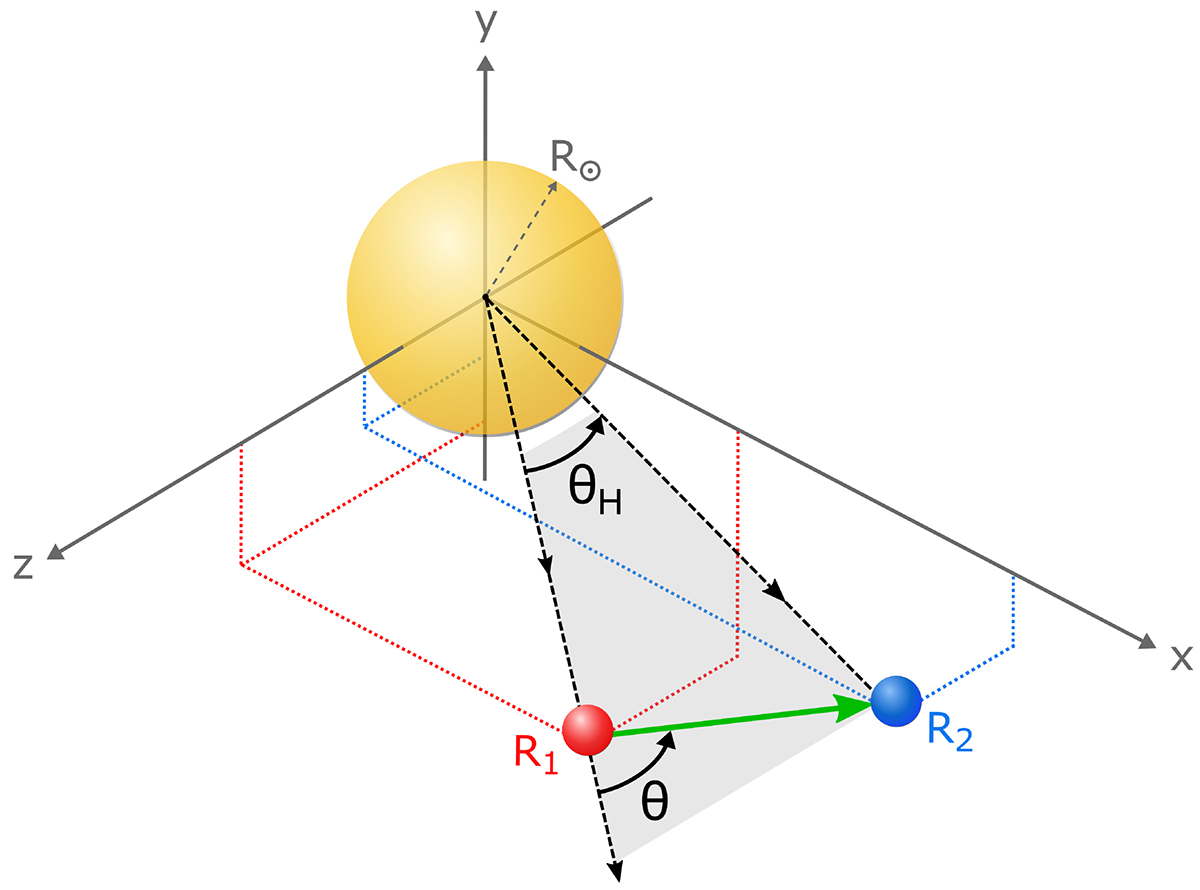
Schematic illustration of the angular separation θ calculated in the plane of the two spacecraft (grey shaded area) from the Sun-source axis to the vector connecting the spacecraft (green arrow). The heliocentric angle θH is also shown for comparison. The red dot at R1 represents the spacecraft observing the Langmuir waves and thus the radio source location, whereas the blue dot at R2 represents the other spacecraft. The origin of the 3D Cartesian coordinate system is at the solar centre.
Current usage metrics show cumulative count of Article Views (full-text article views including HTML views, PDF and ePub downloads, according to the available data) and Abstracts Views on Vision4Press platform.
Data correspond to usage on the plateform after 2015. The current usage metrics is available 48-96 hours after online publication and is updated daily on week days.
Initial download of the metrics may take a while.