Fig. 3
Download original image
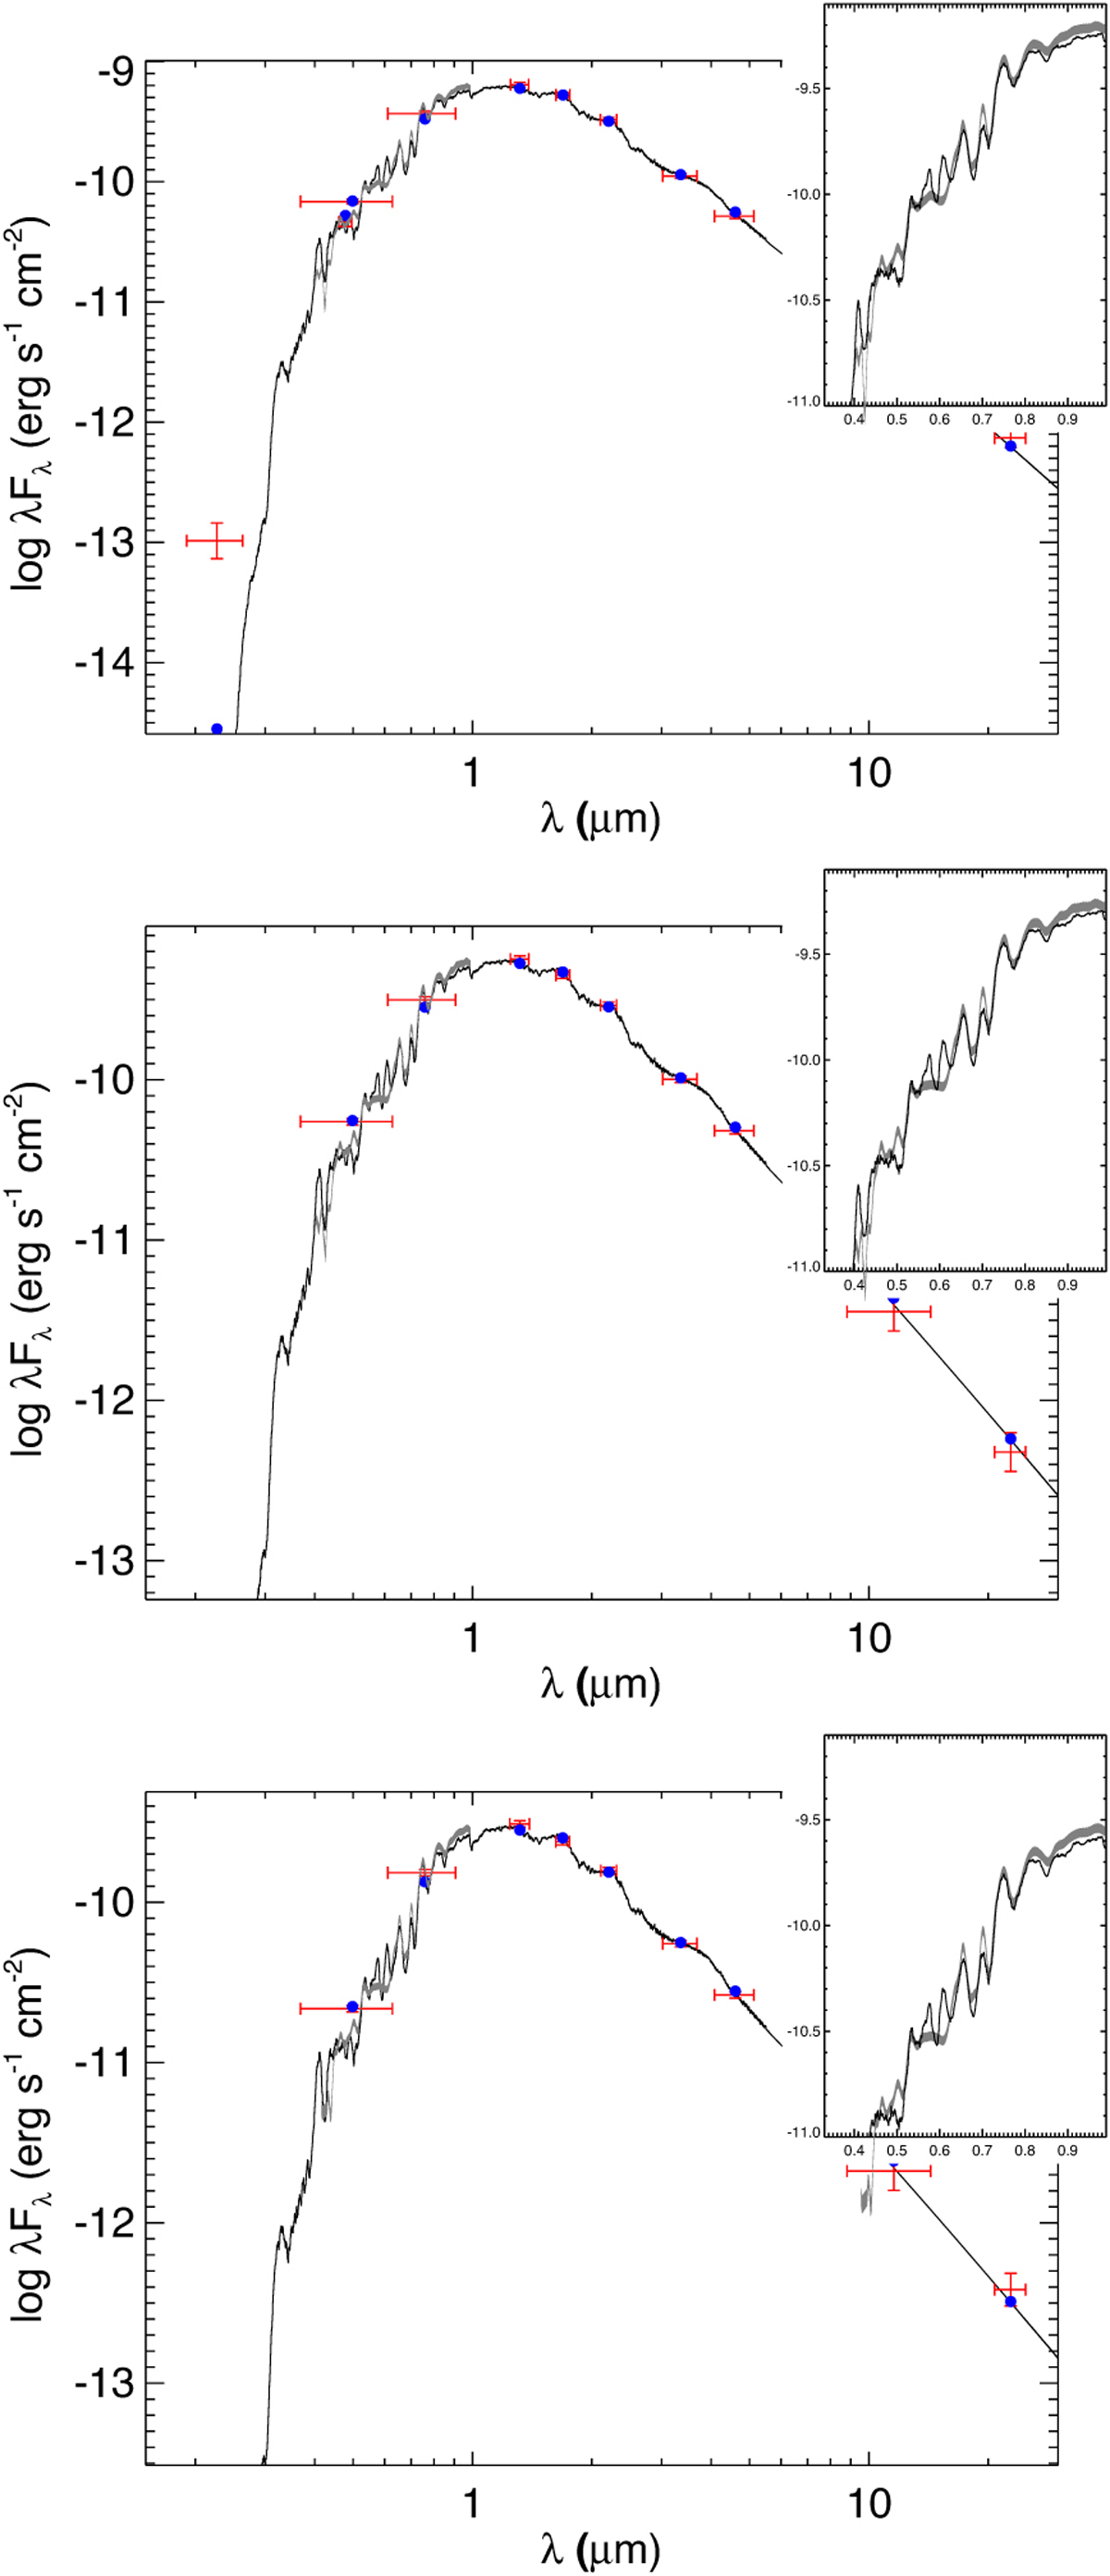
Spectral energy distribution of TOI-4336 A (top panel) and its companion stars TOI-4336 Β (middle panel) and TOI-4336 C (bottom panel). Red symbols represent the observed photometric measurements, the horizontal bars represent the effective width of the passband. Blue symbols are the model fluxes from the best-fit PHOENIX atmosphere model (black). The Gaia spectrophotometry is represented as a grey swathe; a closeup view is shown in the inset.
Current usage metrics show cumulative count of Article Views (full-text article views including HTML views, PDF and ePub downloads, according to the available data) and Abstracts Views on Vision4Press platform.
Data correspond to usage on the plateform after 2015. The current usage metrics is available 48-96 hours after online publication and is updated daily on week days.
Initial download of the metrics may take a while.