Fig. 3.
Download original image
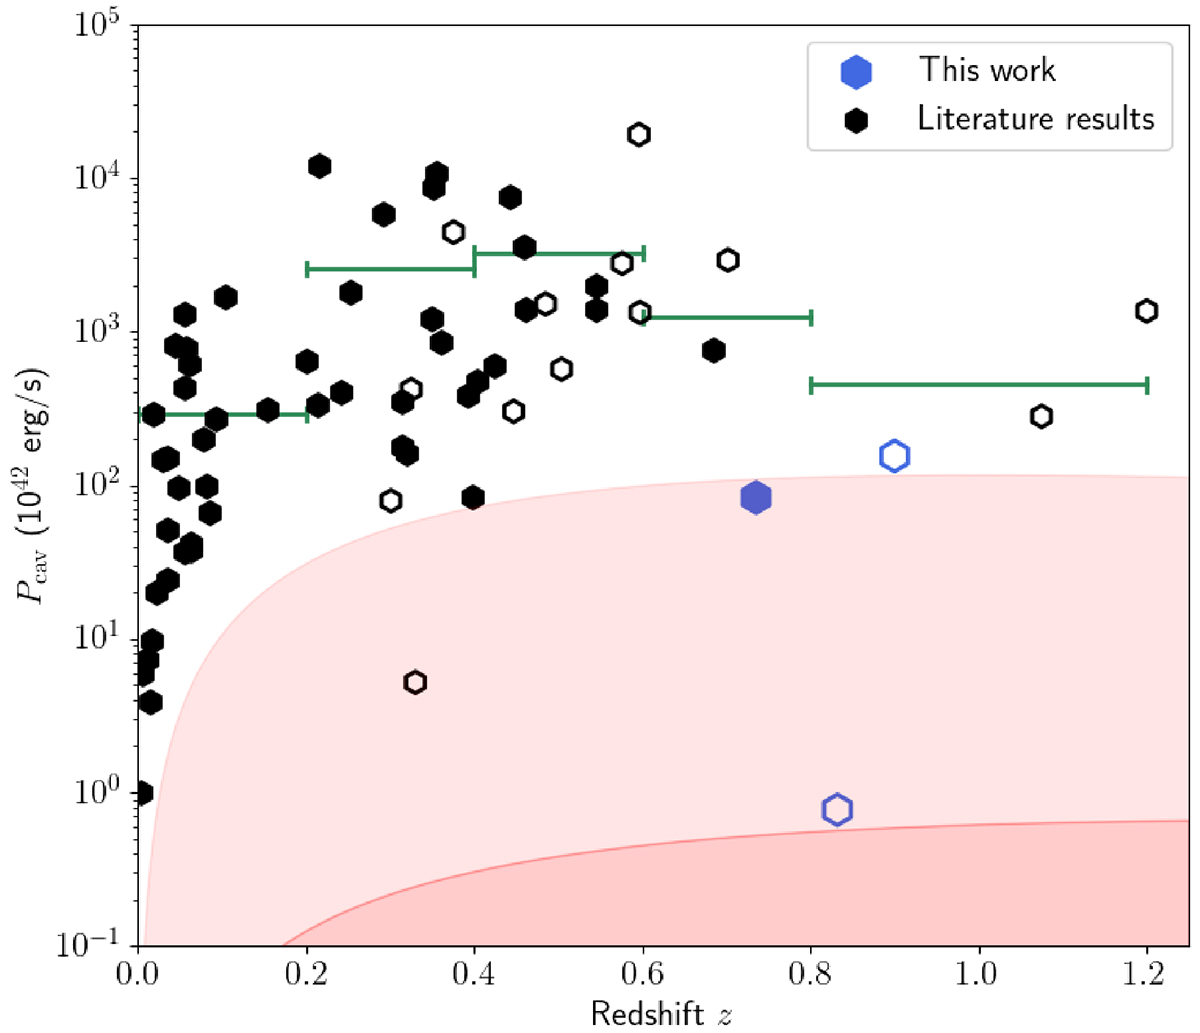
Cavity power per galaxy cluster as a function of redshift. The blue data points indicate the three radio-lobe systems detected in our sample, and the black data points indicate the cavity power estimates published by Rafferty et al. (2006), Hlavacek-Larrondo et al. (2012), Hlavacek-Larrondo et al. (2015), and Timmerman et al. (2022). Cavity/radio lobe systems that were indicated as “low significance” are indicated with open data points, whereas reliable detections are indicated with solid data points. The green bars show the average cavity power within each redshift bin, indicated by the width of each bar. The light red region indicates the approximate region that is not accessible by six arcsecond observations, such as those taken with only the Dutch part of LOFAR. The darker red region indicates the approximate region, which is not accessible by 0.3 arcsec observations, such at those taken with the complete ILT.
Current usage metrics show cumulative count of Article Views (full-text article views including HTML views, PDF and ePub downloads, according to the available data) and Abstracts Views on Vision4Press platform.
Data correspond to usage on the plateform after 2015. The current usage metrics is available 48-96 hours after online publication and is updated daily on week days.
Initial download of the metrics may take a while.