Fig. 2.
Download original image
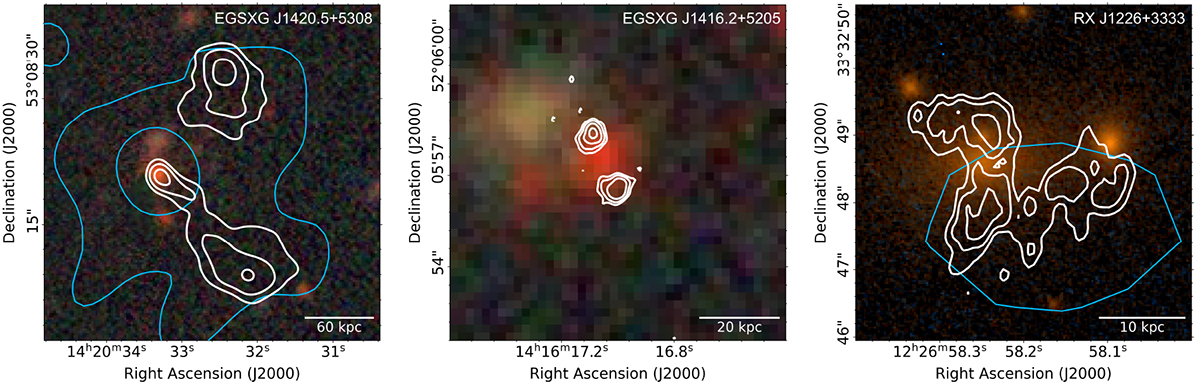
Optical images of three BCGs in our sample for which radio lobes have been detected with LOFAR. The optical images for the two EXSXG clusters were obtained from the DESI Legacy Imaging Survey’s g, r, and z bands (Dey et al. 2019), whereas for RX J1226+3333 the optical image was obtained from Hubble Space Telescope observations with the ACS/WFC detector in the F850LP, F625W, and F435W filters. The white contours indicate the radio emission at 144 MHz, are drawn at 4σrms, and increase in factors of two. The blue contours indicate the 0.5−7 keV X-ray emission as detected by the Chandra X-Ray Observatory. The scale bar in the bottom right corner of each panel measures the listed length at the redshift of the respective cluster.
Current usage metrics show cumulative count of Article Views (full-text article views including HTML views, PDF and ePub downloads, according to the available data) and Abstracts Views on Vision4Press platform.
Data correspond to usage on the plateform after 2015. The current usage metrics is available 48-96 hours after online publication and is updated daily on week days.
Initial download of the metrics may take a while.