Open Access
Fig. A.1.
Download original image
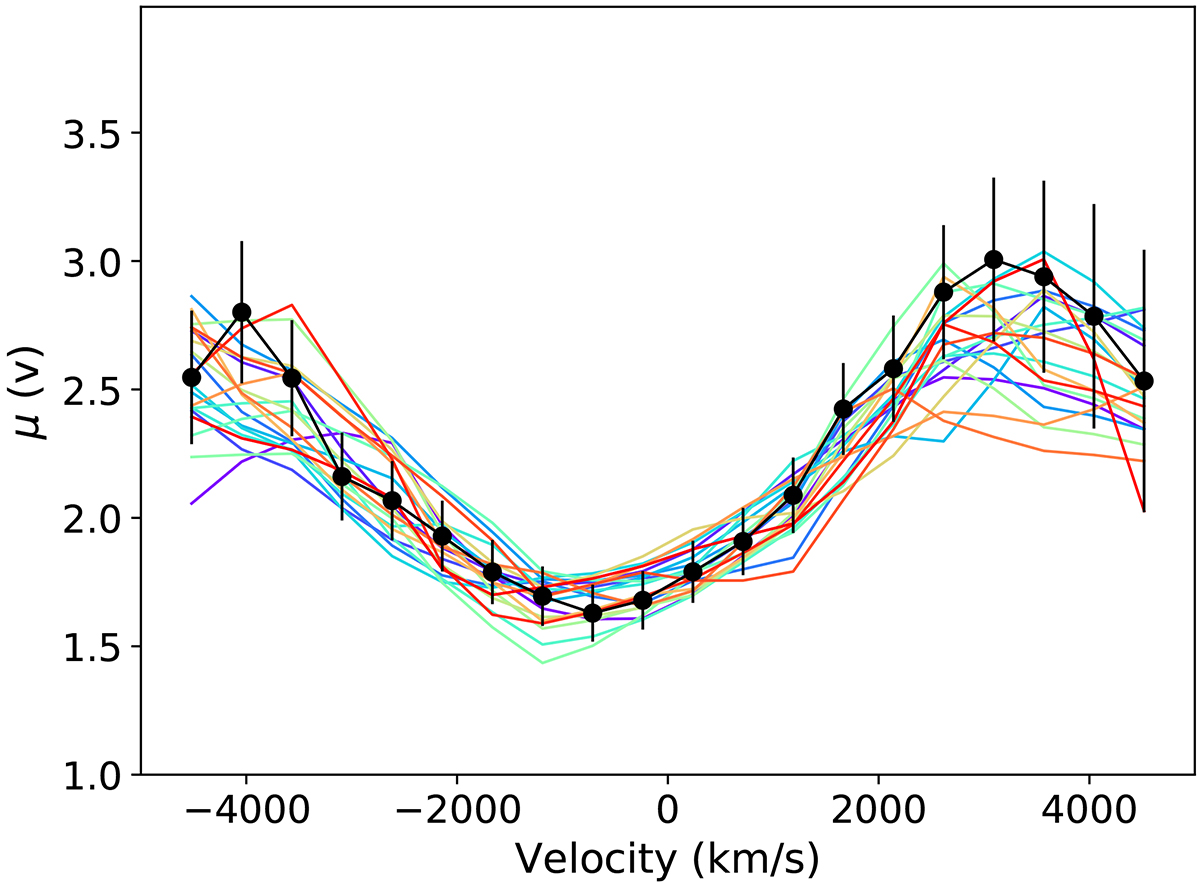
Example of 20 simulated μ(v) profiles (in color) that fit the μ(v) profiles measured for the C IV emission line (in black with error bars). The simulated profiles were computed for the KD model with i = 34°, q = 3, rin = 0.1 rE, and selected with χ2/nd.o.f. ≤ 1.2.
Current usage metrics show cumulative count of Article Views (full-text article views including HTML views, PDF and ePub downloads, according to the available data) and Abstracts Views on Vision4Press platform.
Data correspond to usage on the plateform after 2015. The current usage metrics is available 48-96 hours after online publication and is updated daily on week days.
Initial download of the metrics may take a while.