Fig. 2.
Download original image
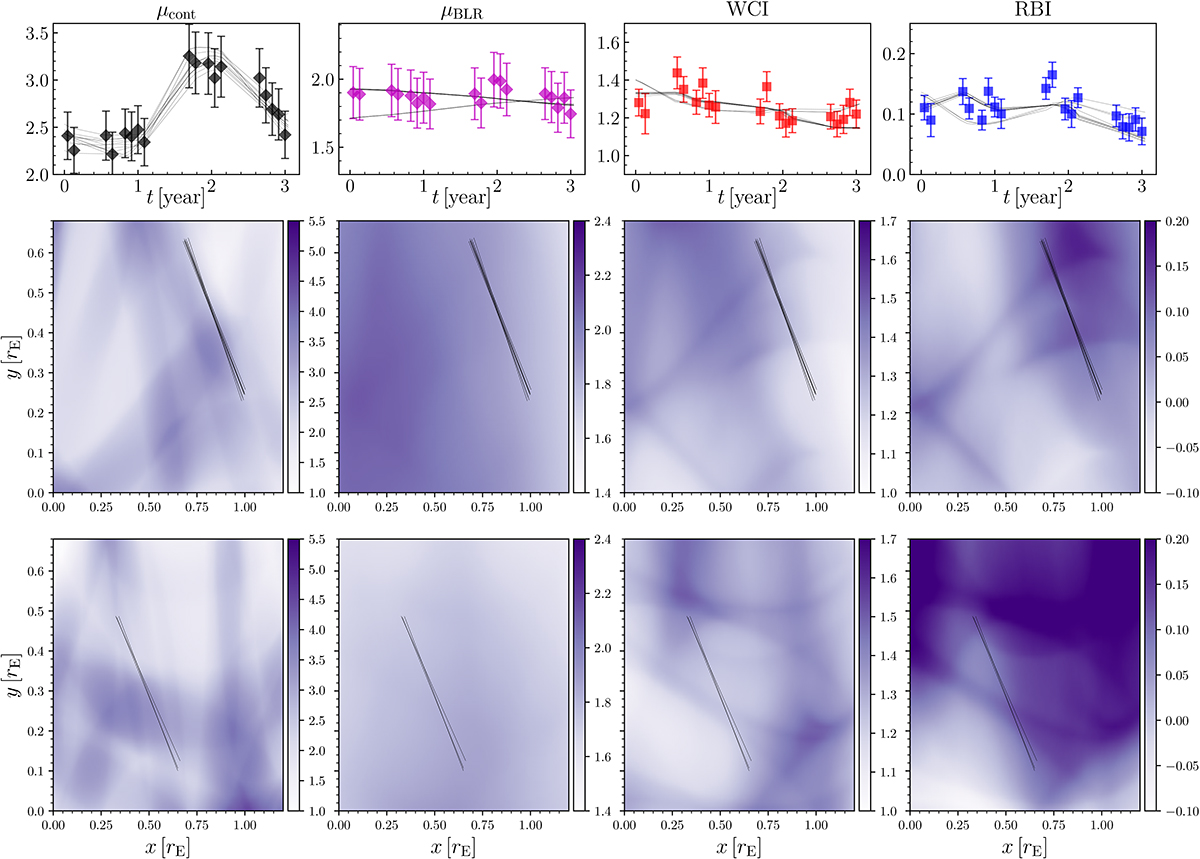
Microlensing model used to reproduce the observed index time series. From left to right: μcont, μBLR, WCI, and RBI. Top panels: Rebinned time series of the four observed indices computed from the spectra of images A and D obtained at the same epoch. The solid lines denote the reconstructed time series. Bottom panels: tracks (solid lines) sampled from two different regions that reproduce the indices in the top panels. In that example, the BLR model is characterized as KD, i = 22°, q = 1.5, rin = 0.5 rE, rs = 0.1 rE. The bottom panels present only two out of many regions on a much wider map. The units of the tracks are converted to rE for v⊥ = 500 km s−1.
Current usage metrics show cumulative count of Article Views (full-text article views including HTML views, PDF and ePub downloads, according to the available data) and Abstracts Views on Vision4Press platform.
Data correspond to usage on the plateform after 2015. The current usage metrics is available 48-96 hours after online publication and is updated daily on week days.
Initial download of the metrics may take a while.