Open Access
Fig. 1.
Download original image
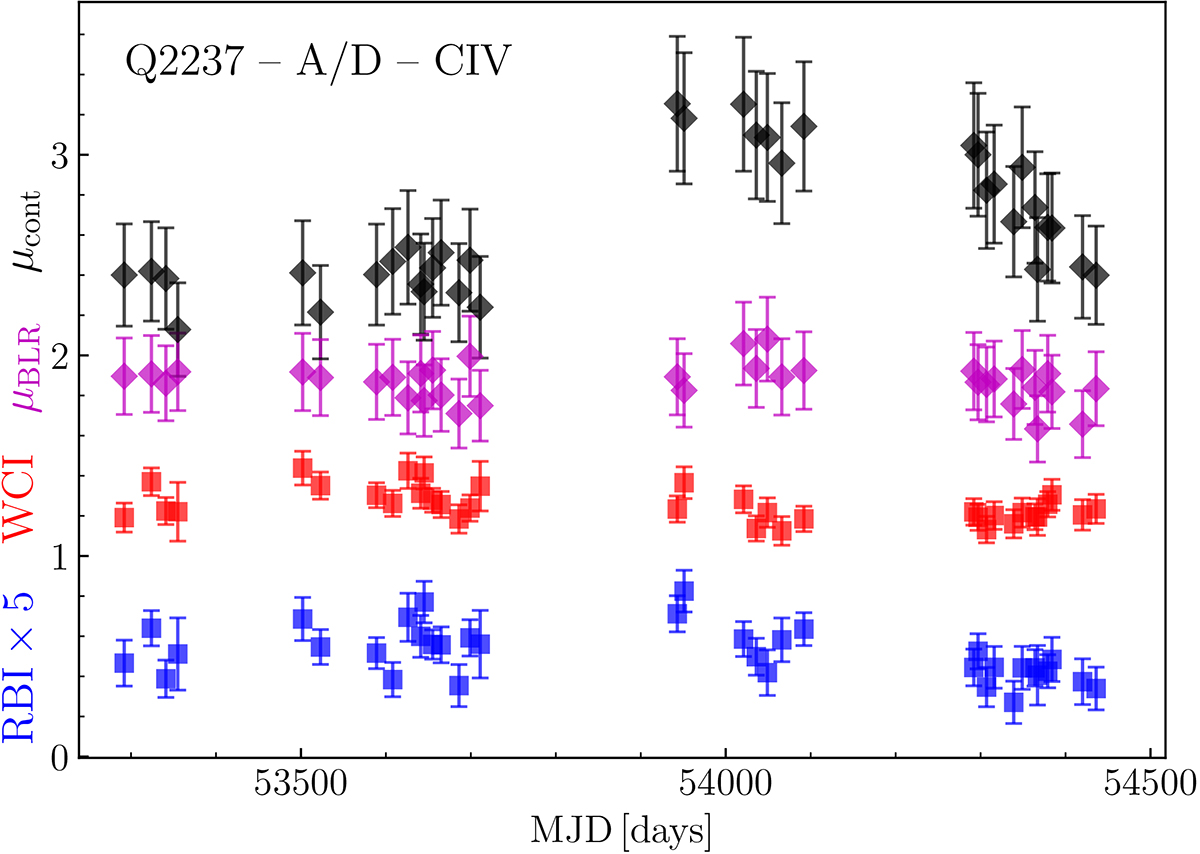
Time series of the four indices computed for C IV line from the spectra of images A and D obtained at the same epoch. The indices μcont, μBLR, WCI, and RBI are denoted in black, magenta, red, and blue, respectively. The values for RBI are multiplied by 5 for clarity.
Current usage metrics show cumulative count of Article Views (full-text article views including HTML views, PDF and ePub downloads, according to the available data) and Abstracts Views on Vision4Press platform.
Data correspond to usage on the plateform after 2015. The current usage metrics is available 48-96 hours after online publication and is updated daily on week days.
Initial download of the metrics may take a while.