Fig. 14.
Download original image
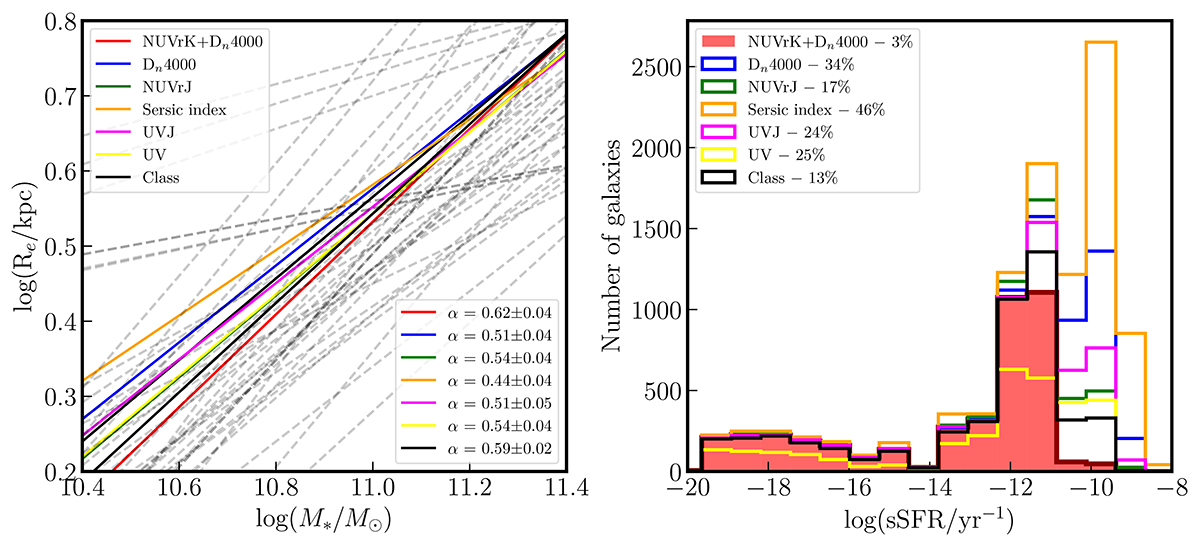
Comparison of the MSR depending on different selection methods. Left: MSR for the different selection criteria discussed in the text with their associated slope and uncertainty. The dashed gray lines represent the MSRs from the literature shown in Fig. 5. Right: sSFR distribution for the different selection criteria with the fraction of blue galaxies (log(sSFR/yr−1)≥ − 11) for each of them shown on the top left corner.
Current usage metrics show cumulative count of Article Views (full-text article views including HTML views, PDF and ePub downloads, according to the available data) and Abstracts Views on Vision4Press platform.
Data correspond to usage on the plateform after 2015. The current usage metrics is available 48-96 hours after online publication and is updated daily on week days.
Initial download of the metrics may take a while.