Open Access
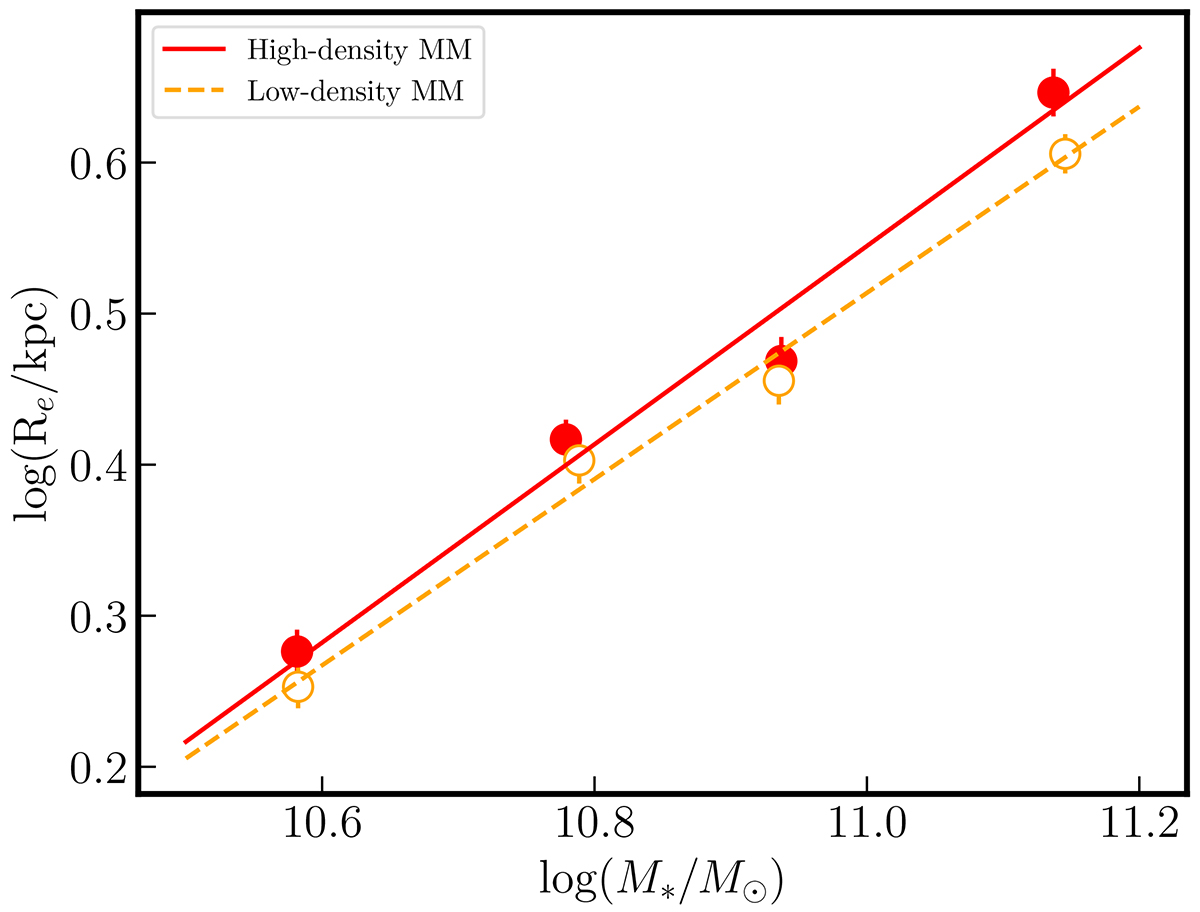
Fig. 11.
Download original image
MSR for HD and LD quiescent galaxies in the MM samples. Red filled and orange circles represent the median M*, and the associated linear fits are shown as a red line and orange dashed line.
Current usage metrics show cumulative count of Article Views (full-text article views including HTML views, PDF and ePub downloads, according to the available data) and Abstracts Views on Vision4Press platform.
Data correspond to usage on the plateform after 2015. The current usage metrics is available 48-96 hours after online publication and is updated daily on week days.
Initial download of the metrics may take a while.