Open Access
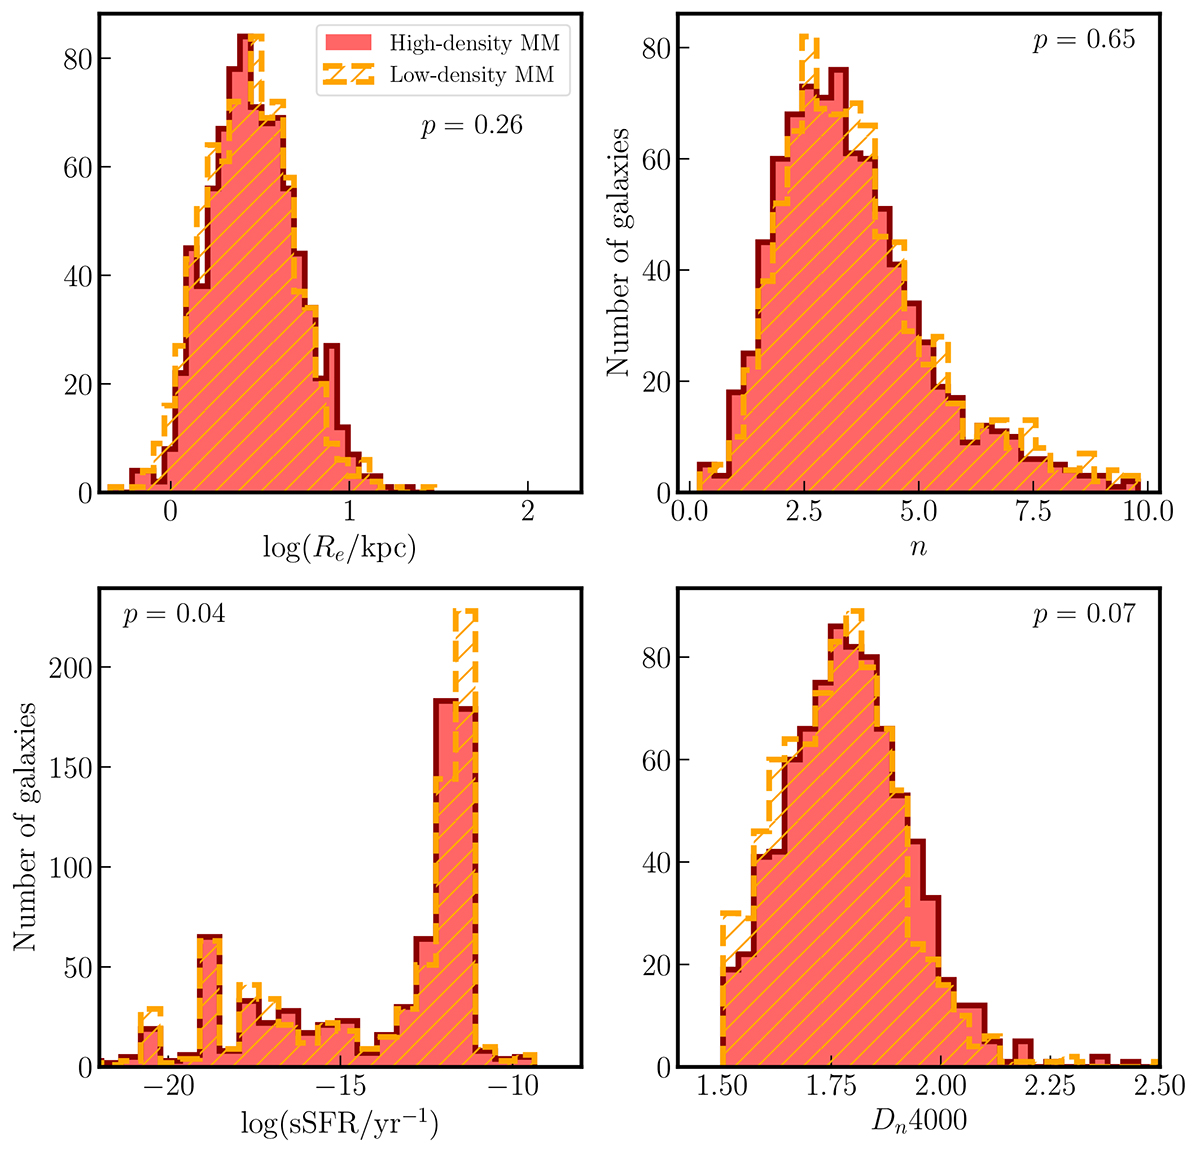
Fig. 10.
Download original image
Distributions of log(Re), n, log(sSFR), and Dn4000 for the HD (red) and LD (orange hash) MM samples. The average p-value of the KS two-sample test between the HD and LD galaxies for the 500 random samplings is shown at the top of each plot.
Current usage metrics show cumulative count of Article Views (full-text article views including HTML views, PDF and ePub downloads, according to the available data) and Abstracts Views on Vision4Press platform.
Data correspond to usage on the plateform after 2015. The current usage metrics is available 48-96 hours after online publication and is updated daily on week days.
Initial download of the metrics may take a while.