Open Access
Fig. 1.
Download original image
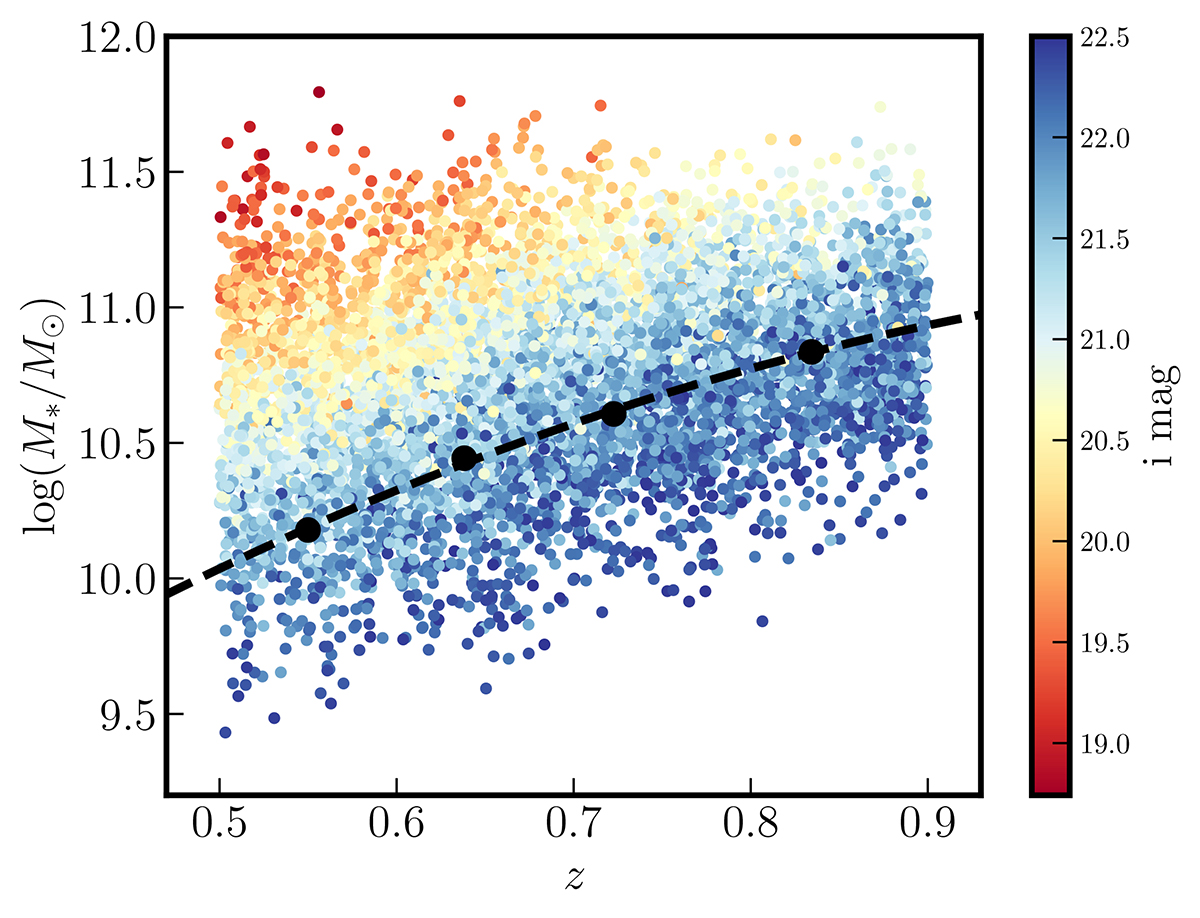
Distribution of log(M*/M⊙) with respect to z where galaxies are color coded based on their i-band magnitude. The black filled circles represent the completeness limit in each redshift bin and the dashed black line shows the completeness limit based on a 2nd order polynomial fit.
Current usage metrics show cumulative count of Article Views (full-text article views including HTML views, PDF and ePub downloads, according to the available data) and Abstracts Views on Vision4Press platform.
Data correspond to usage on the plateform after 2015. The current usage metrics is available 48-96 hours after online publication and is updated daily on week days.
Initial download of the metrics may take a while.