Fig. 2.
Download original image
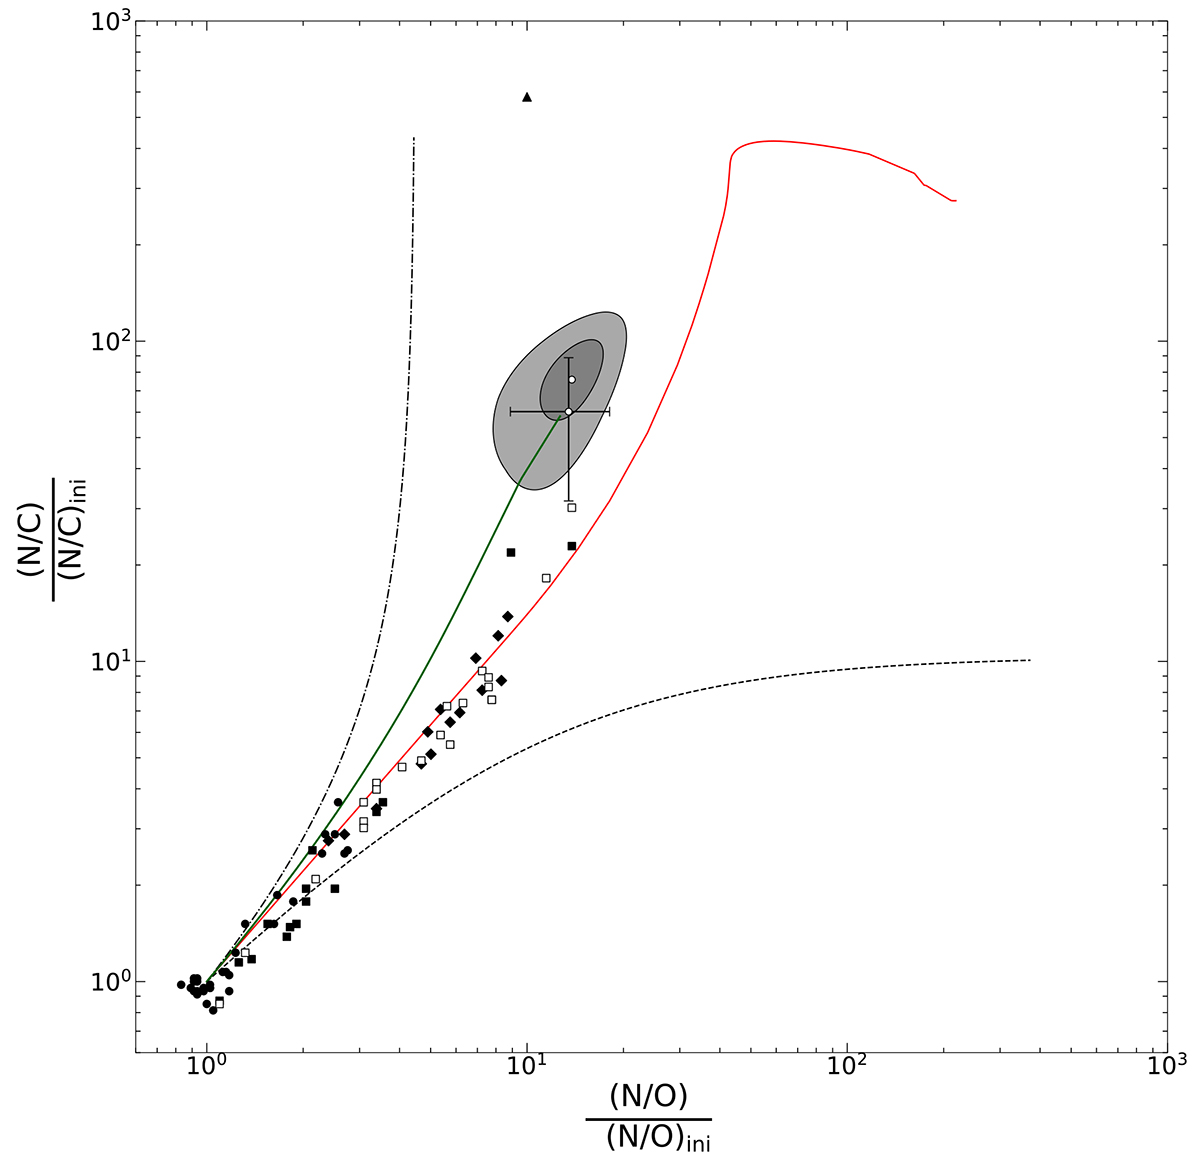
Nitrogen-to-carbon ratio vs. nitrogen-to-oxygen ratio, normalised to initial values. The mixing ratios derived for HD 93840 are depicted as open dots with grey 1σ and 2σ uncertainty regions (ADS) and with error bars depicting the 1σ uncertainty (FASTWIND). Objects from our previous work are indicated: B-type main-sequence stars (Nieva & Simón-Díaz 2011; Nieva & Przybilla 2012, black dots), late O-type main-sequence stars (Aschenbrenner et al. 2023, black squares), BA-type supergiants (Przybilla et al. 2010, black diamonds), B supergiants (Paper I and II, open squares), and the stripped CN-cycled core γ Columbae (Irrgang et al. 2022, black triangle). For comparison, the development of the surface CNO abundances is shown for a 25 M⊙, Ωrot = 0.568 Ωcrit model (Ekström et al. 2012, red) and for a 15 M⊙, Ωrot = 0.95 Ωcrit model (Georgy et al. 2013, green line). The dashed and dash-dotted lines depict the analytical boundaries for the ON- and CN-cycle, respectively. A discussion is provided below.
Current usage metrics show cumulative count of Article Views (full-text article views including HTML views, PDF and ePub downloads, according to the available data) and Abstracts Views on Vision4Press platform.
Data correspond to usage on the plateform after 2015. The current usage metrics is available 48-96 hours after online publication and is updated daily on week days.
Initial download of the metrics may take a while.