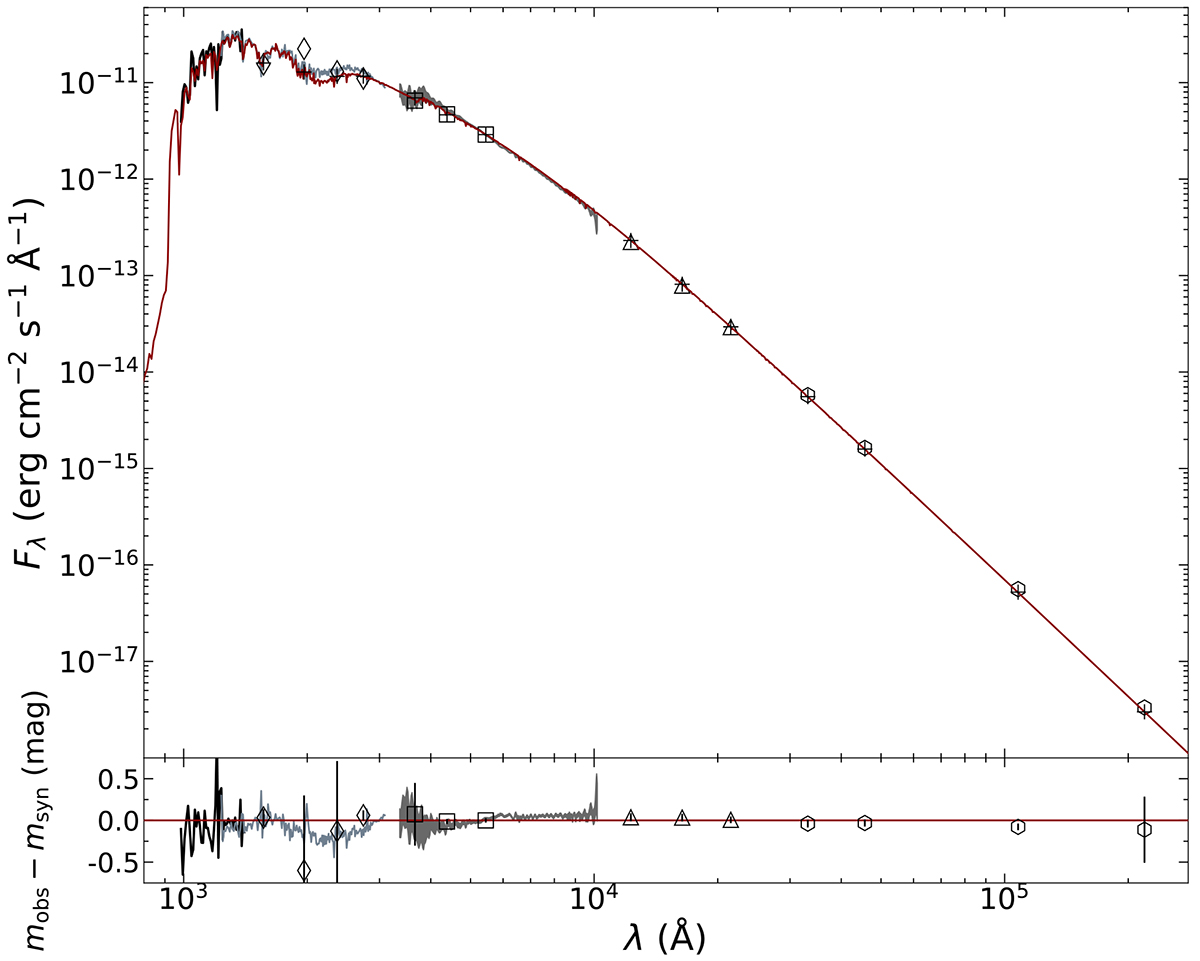
Fig. B.1.

Download original image
Upper panel: the full line follows the loci of stellar masses that reproduce the observed atmospheric parameters (ADS solution) of HD 93840 with distance as independent parameter, the dashed and dashed-dotted lines follow the loci where stellar evolution models of Ekström et al. (2012) show the same Teff as HD 93840, for the rotating and non-rotating case, respectively. Values along the curves indicate luminosities and flight times τflight to reach the distance, adopting the kinematic parameters from Table 1 and assuming ejection from the disk mid-plane, or evolutionary timescales τevol for the models to reach Teff of HD 93840. The vertical short lines indicate the points where τevol = τflight. The vertical dotted line marks dspec, as the division line where HD 93840 would switch from being overluminous to becoming underluminous. Lower panel: posterior cumulative distance distributions (CDF) derived from a Bayesian approach, using the Gaia EDR3 parallax after application of the zero-point correction of Maíz Apellániz (2022), and assuming an uncertainty inflated according to El-Badry et al. (2021, blue CDF), and when considering parallax bias according to Maíz Apellániz (2022, purple CDF). The grey horizontal lines represent the 16th, 50th, and 84th percentile.
Current usage metrics show cumulative count of Article Views (full-text article views including HTML views, PDF and ePub downloads, according to the available data) and Abstracts Views on Vision4Press platform.
Data correspond to usage on the plateform after 2015. The current usage metrics is available 48-96 hours after online publication and is updated daily on week days.
Initial download of the metrics may take a while.


