Fig. 1.
Download original image
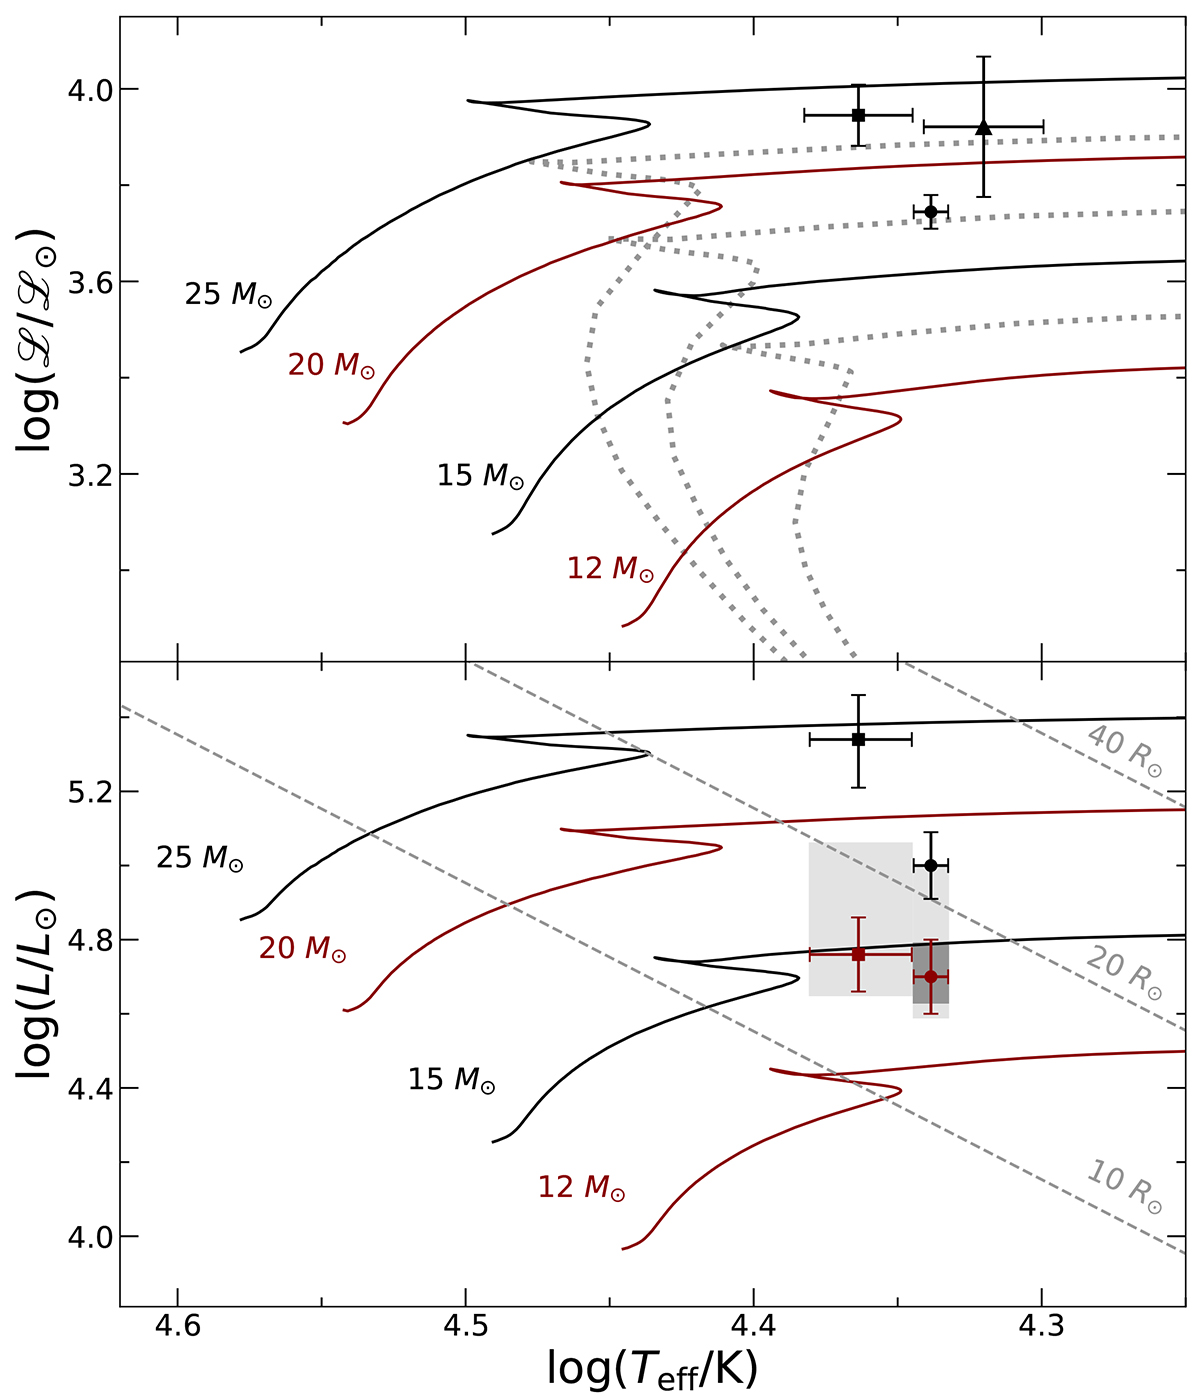
Location of HD 93840 in two diagnostic diagrams, the sHRD (upper panel) and the HRD (lower panel). Parameters derived via ADS (dots), FASTWIND (squares), and TLUSTY (triangle) considering the spectroscopic and Gaia-based distances (i.e. dspec and ![]() , see Appendix B), are depicted as black and red symbols, respectively. The lightgrey boxes span the parameter range obtained when accounting in addition to parallax bias according to Maíz Apellániz (2022), while the darkgrey box represents the finally adopted solution from Table 1. For comparison, loci of evolution tracks for stars rotating at Ωrot = 0.568 Ωcrit (Ekström et al. 2012) are indicated for various zero-age main-sequence (ZAMS) masses. Isochrones for the model grid, corresponding to ages of log τevol ∈ {6.95, 7.05, 7.20} are shown as dotted lines in the upper panel (with age increasing from top to bottom). Error bars indicate 1σ uncertainty ranges. See the text for a discussion.
, see Appendix B), are depicted as black and red symbols, respectively. The lightgrey boxes span the parameter range obtained when accounting in addition to parallax bias according to Maíz Apellániz (2022), while the darkgrey box represents the finally adopted solution from Table 1. For comparison, loci of evolution tracks for stars rotating at Ωrot = 0.568 Ωcrit (Ekström et al. 2012) are indicated for various zero-age main-sequence (ZAMS) masses. Isochrones for the model grid, corresponding to ages of log τevol ∈ {6.95, 7.05, 7.20} are shown as dotted lines in the upper panel (with age increasing from top to bottom). Error bars indicate 1σ uncertainty ranges. See the text for a discussion.
Current usage metrics show cumulative count of Article Views (full-text article views including HTML views, PDF and ePub downloads, according to the available data) and Abstracts Views on Vision4Press platform.
Data correspond to usage on the plateform after 2015. The current usage metrics is available 48-96 hours after online publication and is updated daily on week days.
Initial download of the metrics may take a while.