Open Access
Fig. 8.
Download original image
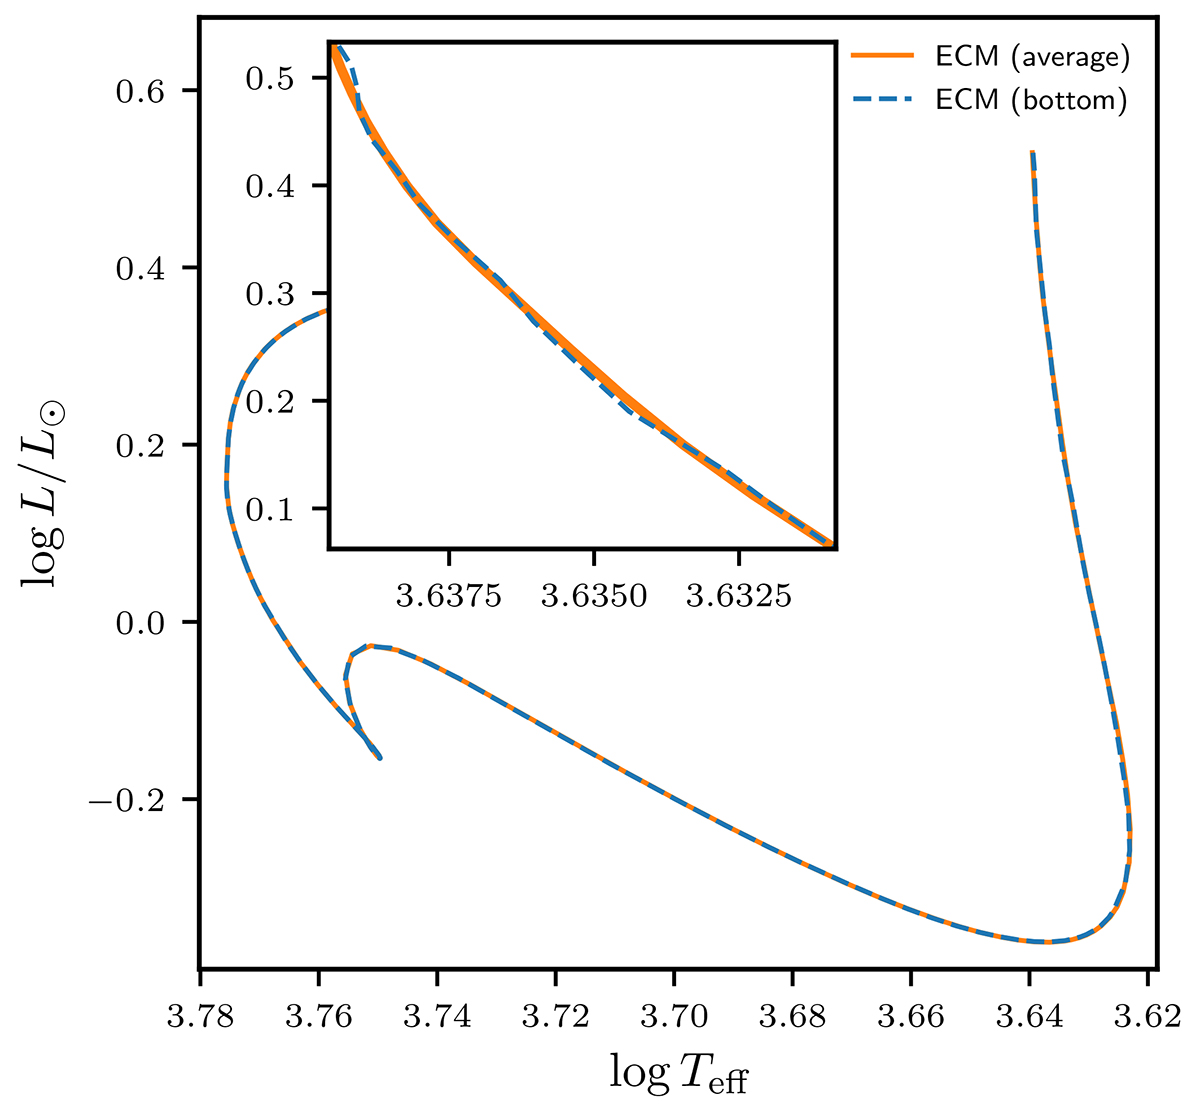
HR diagram of the same entropy-calibrated model, using the M13 prescription, but different methods for evaluating the entropy of the adiabat in the 1D structure model: ![]() in orange and
in orange and ![]() in blue. The subplot shows a zoom of the Hayashi track.
in blue. The subplot shows a zoom of the Hayashi track.
Current usage metrics show cumulative count of Article Views (full-text article views including HTML views, PDF and ePub downloads, according to the available data) and Abstracts Views on Vision4Press platform.
Data correspond to usage on the plateform after 2015. The current usage metrics is available 48-96 hours after online publication and is updated daily on week days.
Initial download of the metrics may take a while.