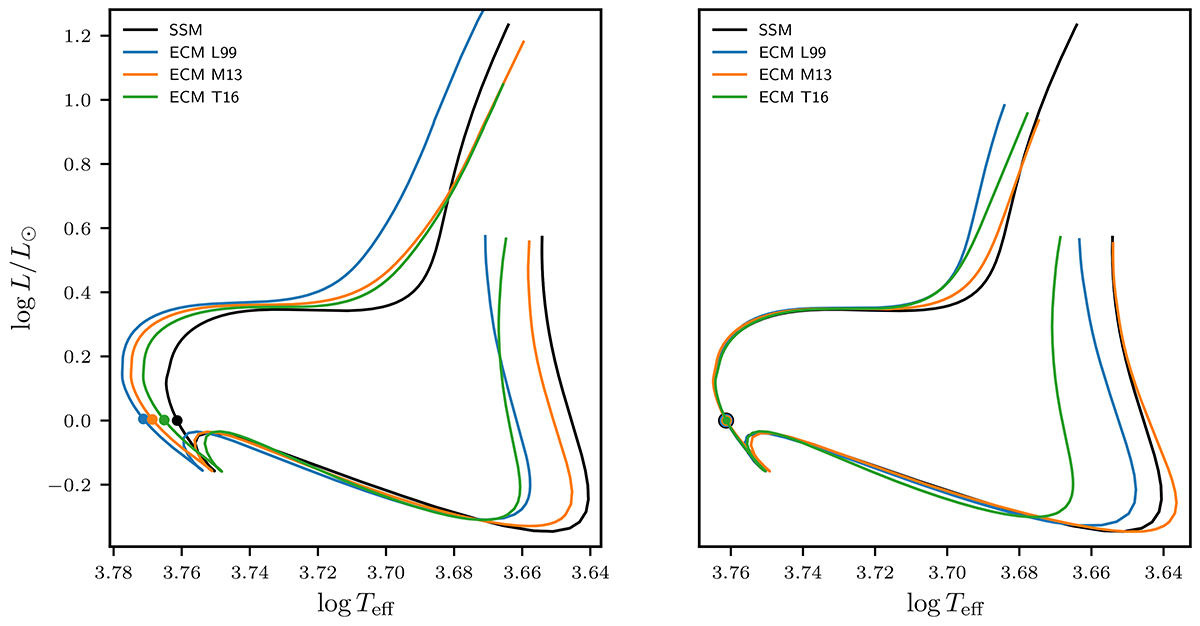
Fig. 3.
Download original image
HR diagram of a standard solar model (black line) and associated entropy-calibrated models shown in the left panel, with the uncorrected prescriptions: L99 (blue), M13 (orange), and T16 (green) taken “as is” Dots represent the location of each model at solar age. Right panel displays the HR diagram of a standard solar model (black line) and associated entropy-calibrated models with the prescriptions L99 (blue), M13 (orange), and T16 (green) corrected using Eq. (11). Dots represent the location of each model at solar age.
Current usage metrics show cumulative count of Article Views (full-text article views including HTML views, PDF and ePub downloads, according to the available data) and Abstracts Views on Vision4Press platform.
Data correspond to usage on the plateform after 2015. The current usage metrics is available 48-96 hours after online publication and is updated daily on week days.
Initial download of the metrics may take a while.