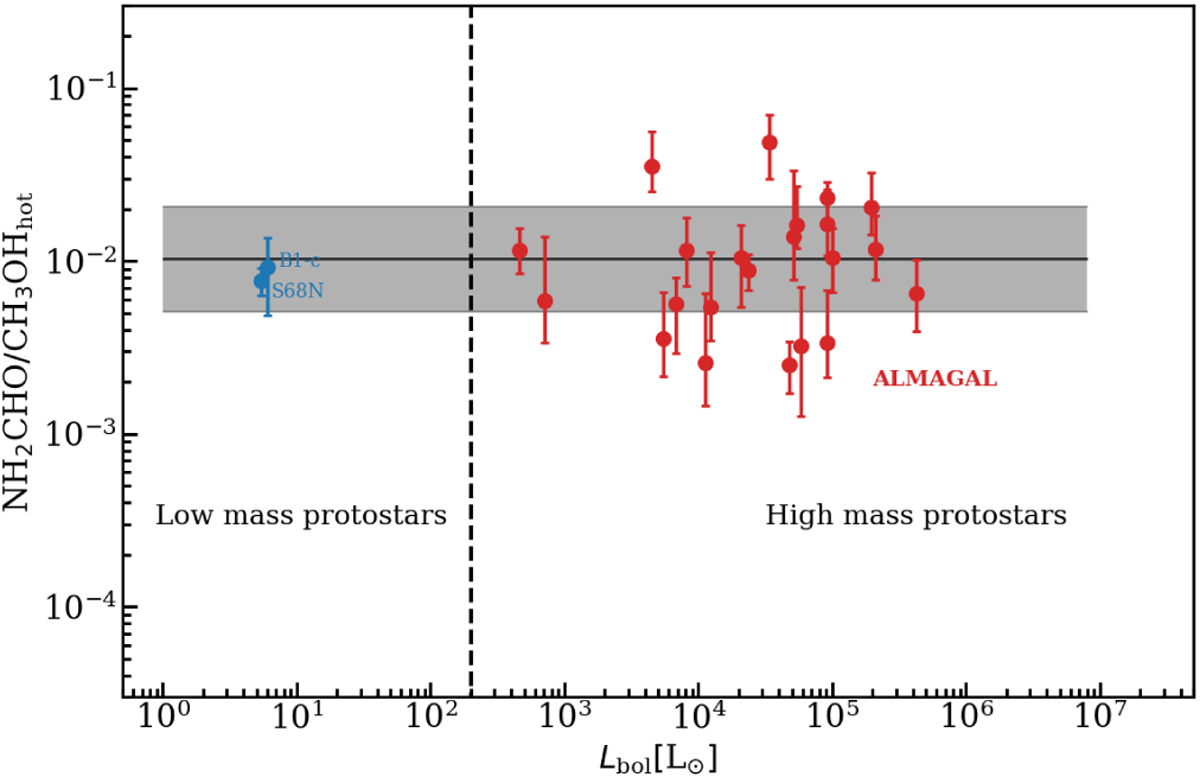
Fig. 7
Download original image
Column density ratio of formamide to hot methanol. The red signs show the ALMAGAL sources, and the blue signs are the two low-mass sources, B1-c and S68N. The gray area shows the weighted standard deviation of log10 of the data points around the weighted mean of log10 of the data points (black solid line). The hot column densities for methanol are taken from Nazari et al. (2023b), and the column densities of formamide are taken from Nazari et al. (2021, 2022a). When focusing on methanol only at high temperatures closer to the sublimation temperature of formamide, the scatter is reduced.
Current usage metrics show cumulative count of Article Views (full-text article views including HTML views, PDF and ePub downloads, according to the available data) and Abstracts Views on Vision4Press platform.
Data correspond to usage on the plateform after 2015. The current usage metrics is available 48-96 hours after online publication and is updated daily on week days.
Initial download of the metrics may take a while.