Open Access
Fig. 6
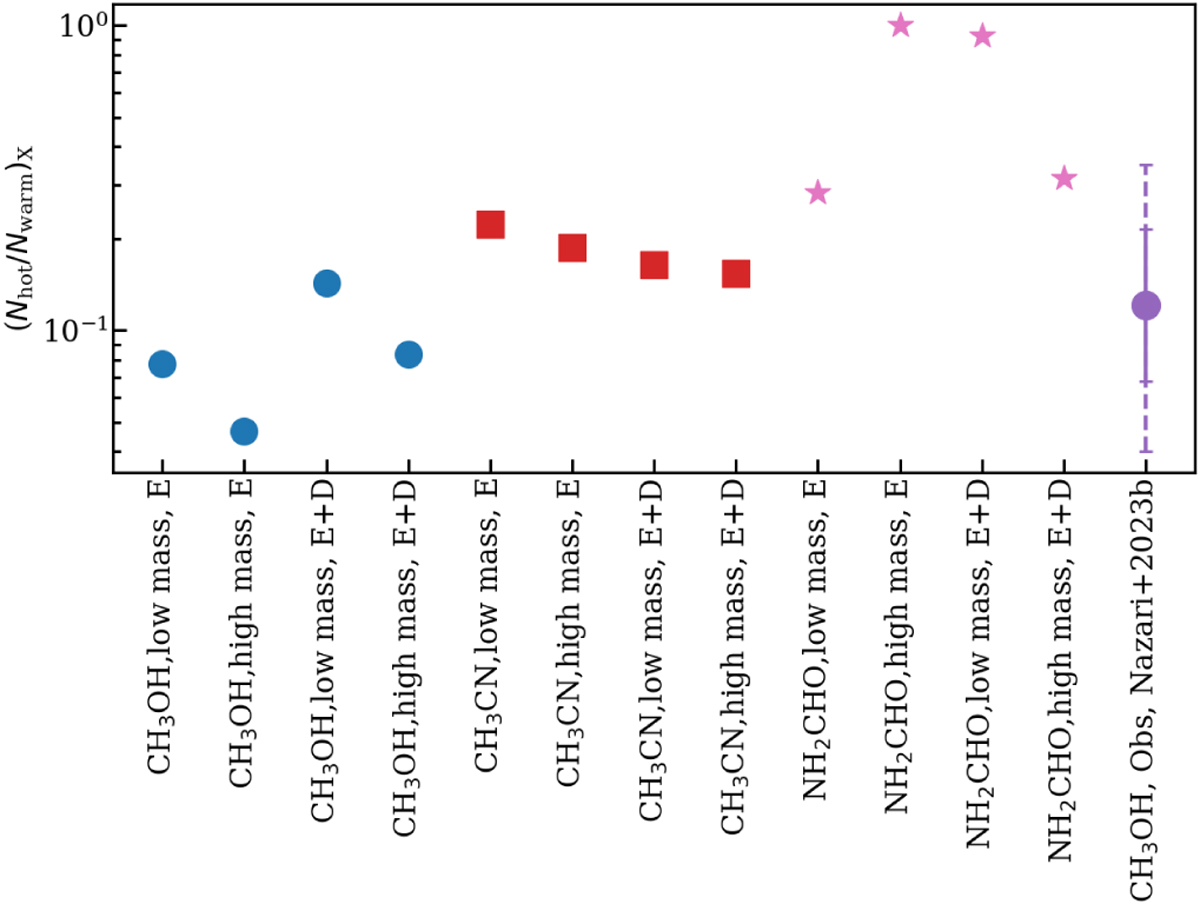
Download original image
Column density ratios of 100–150 K gas to those of 300 K gas for our fiducial envelope-only and envelope-plus-disk models and from observations of Nazari et al. (2023b). The solid error bar shows the standard deviation around the mean of observations, while the dashed error bar shows the range in the observational data.
Current usage metrics show cumulative count of Article Views (full-text article views including HTML views, PDF and ePub downloads, according to the available data) and Abstracts Views on Vision4Press platform.
Data correspond to usage on the plateform after 2015. The current usage metrics is available 48-96 hours after online publication and is updated daily on week days.
Initial download of the metrics may take a while.