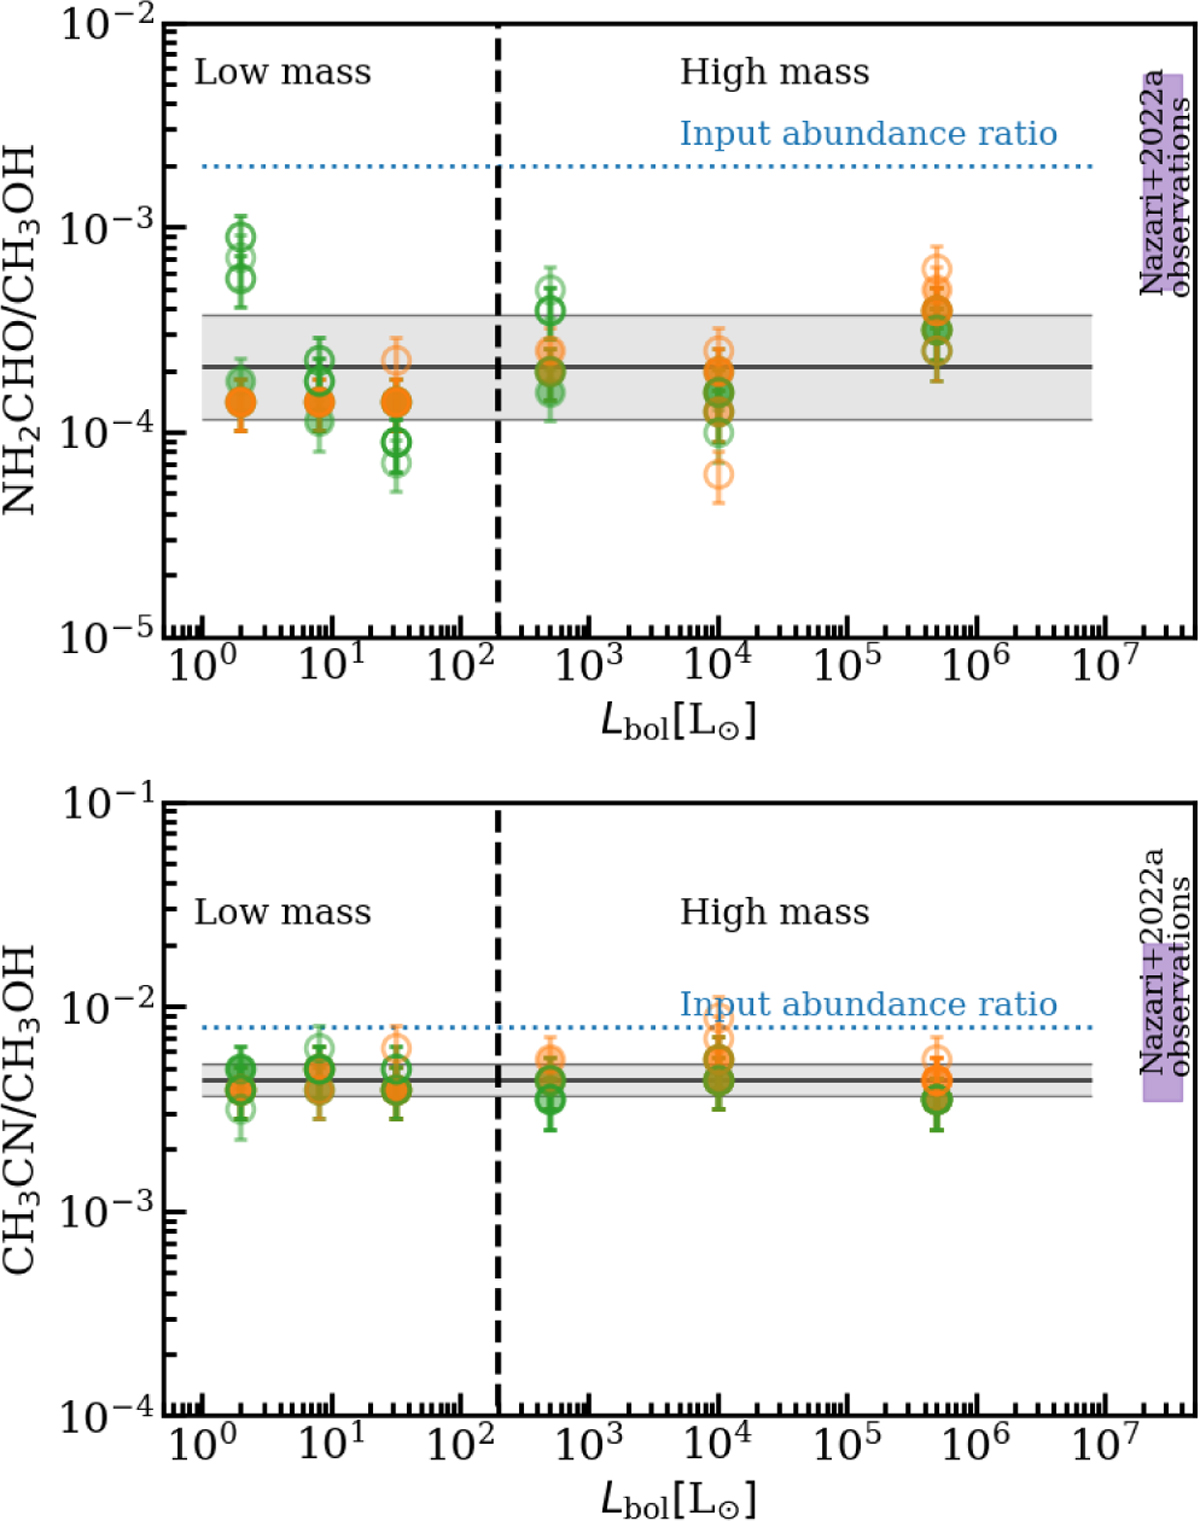
Fig. 5
Download original image
Column density ratios of formamide (top) and methyl cyanide (bottom) to methanol as a function of luminosity for all the models. The solid line shows the weighted mean (by errors) of the log10 of the model points. The gray area presents the weighted standard deviation of the model results. Green shows models with low-millimeter opacity dust, and orange shows those with high-millimeter opacity dust. Empty circles show the models with a disk, and the filled ones present the models without a disk. The purple bar shows one standard deviation below and one standard deviation above the mean of the observational data for low- and high-mass protostars in Nazari et al. (2022a). The horizontal dotted lines show the abundances assumed in the models. The models with non-detection of methanol are not plotted.
Current usage metrics show cumulative count of Article Views (full-text article views including HTML views, PDF and ePub downloads, according to the available data) and Abstracts Views on Vision4Press platform.
Data correspond to usage on the plateform after 2015. The current usage metrics is available 48-96 hours after online publication and is updated daily on week days.
Initial download of the metrics may take a while.