Fig. 3
Download original image
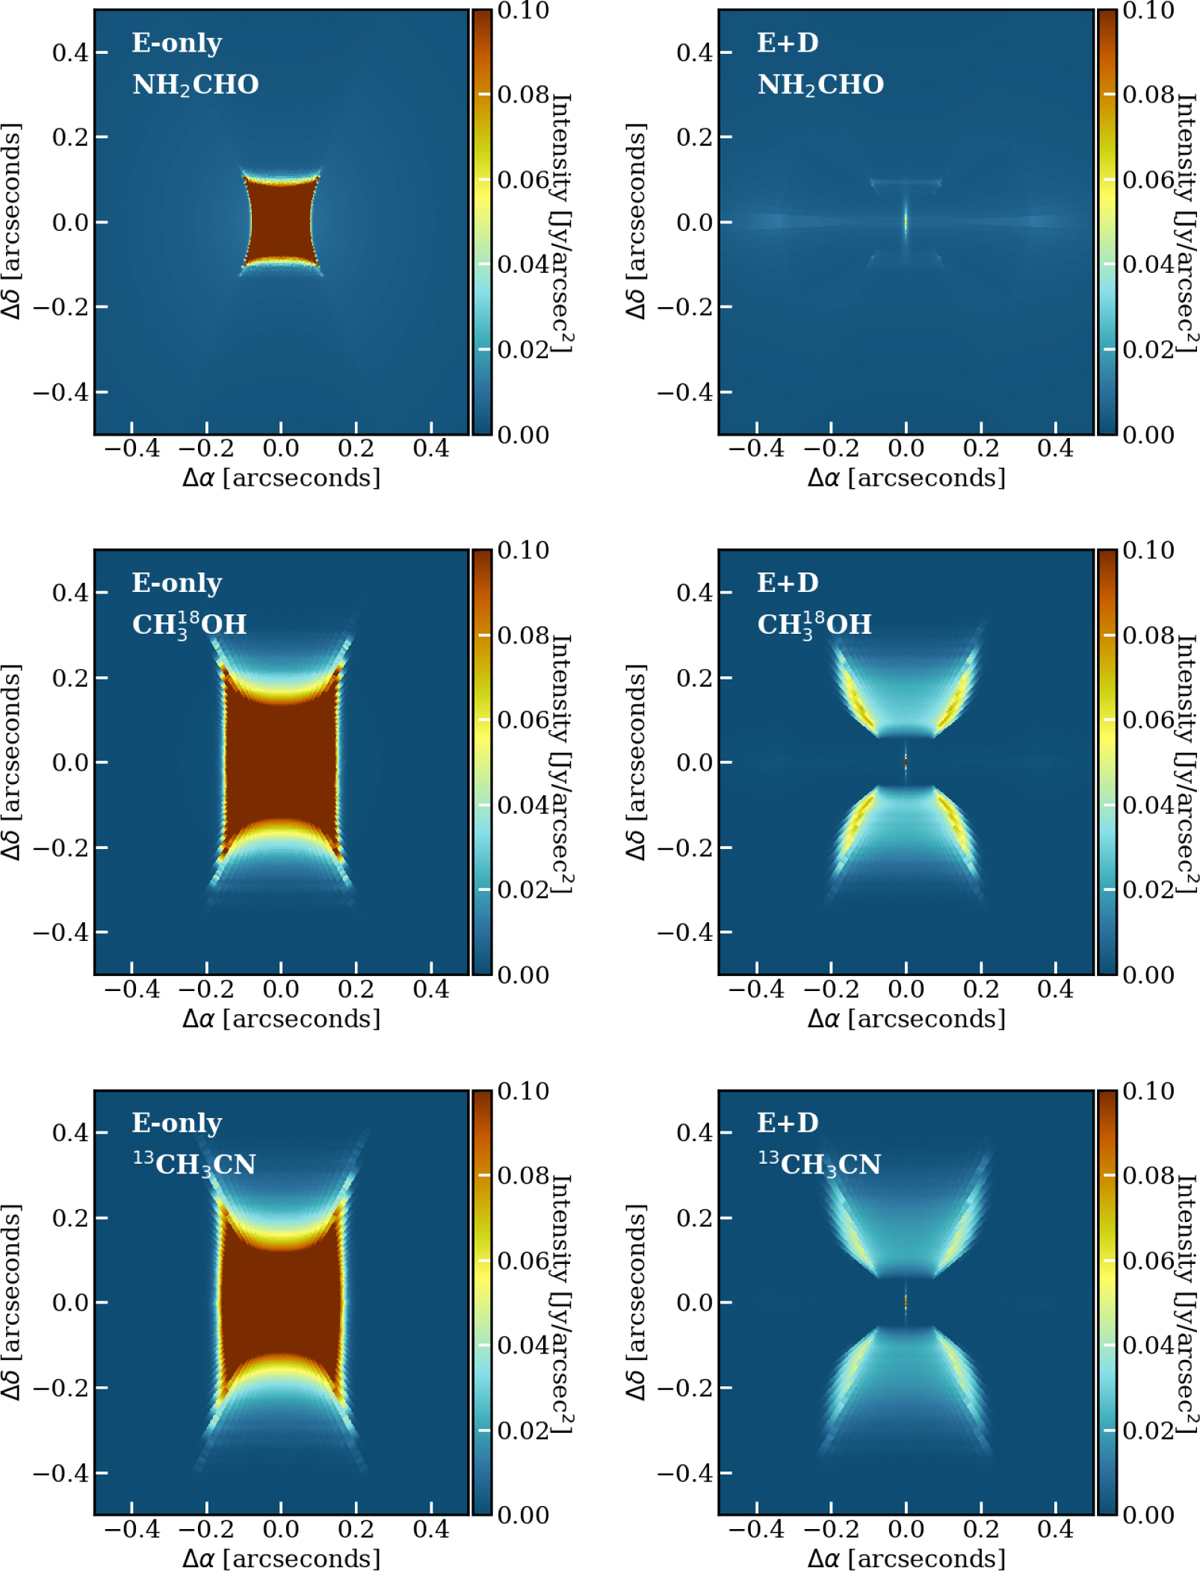
Edge-on images of formamide (top row), methanol (middle), and methyl cyanide (bottom row) at the line emission peak in the low-mass envelope-only, “E-only”, and envelope-plus-disk, “E+D”, fiducial models. Dust was not included in these runs to avoid additional emission from dust (in all other runs, dust is included unless specified). Here the lines are NH2CHO 143,11 −133,10 (ν = 299.2552 GHz, Eup = 134.1 K); CH3OH 101,10,2−90,91 (ν = 326.9612 GHz, Eup = 133.1 K), run with 18O abundance; and CH3CN 123,0 − 11−3,0 (ν = 220.7089 GHz and Eup = 133.2 K), run with 13C abundance. The emission from formamide is less extended than that from methanol and methyl cyanide.
Current usage metrics show cumulative count of Article Views (full-text article views including HTML views, PDF and ePub downloads, according to the available data) and Abstracts Views on Vision4Press platform.
Data correspond to usage on the plateform after 2015. The current usage metrics is available 48-96 hours after online publication and is updated daily on week days.
Initial download of the metrics may take a while.