Fig. 2
Download original image
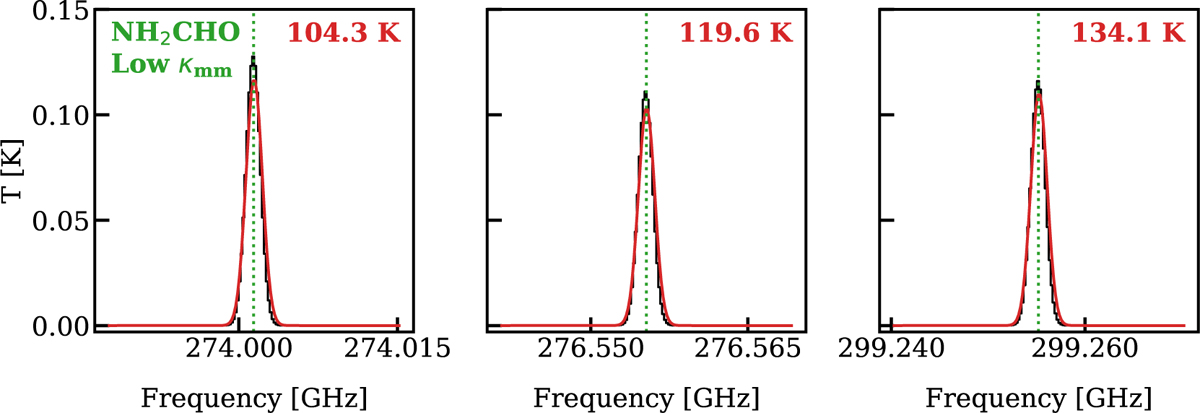
Simulated data from RADMC-3D (in black), with the fit CASSIS model in red and with Tex fixed at 150 K. The upper energy levels are printed on the top right of each panel. The dotted green lines mark the transition frequency of each line. This is for the fiducial envelope-only low-mass model (L = 8 L⊙, ME = 1 M⊙ with low-millimeter opacity dust; see Figs. B.2–B.4 for other fitting examples).
Current usage metrics show cumulative count of Article Views (full-text article views including HTML views, PDF and ePub downloads, according to the available data) and Abstracts Views on Vision4Press platform.
Data correspond to usage on the plateform after 2015. The current usage metrics is available 48-96 hours after online publication and is updated daily on week days.
Initial download of the metrics may take a while.