Fig. B.7
Download original image
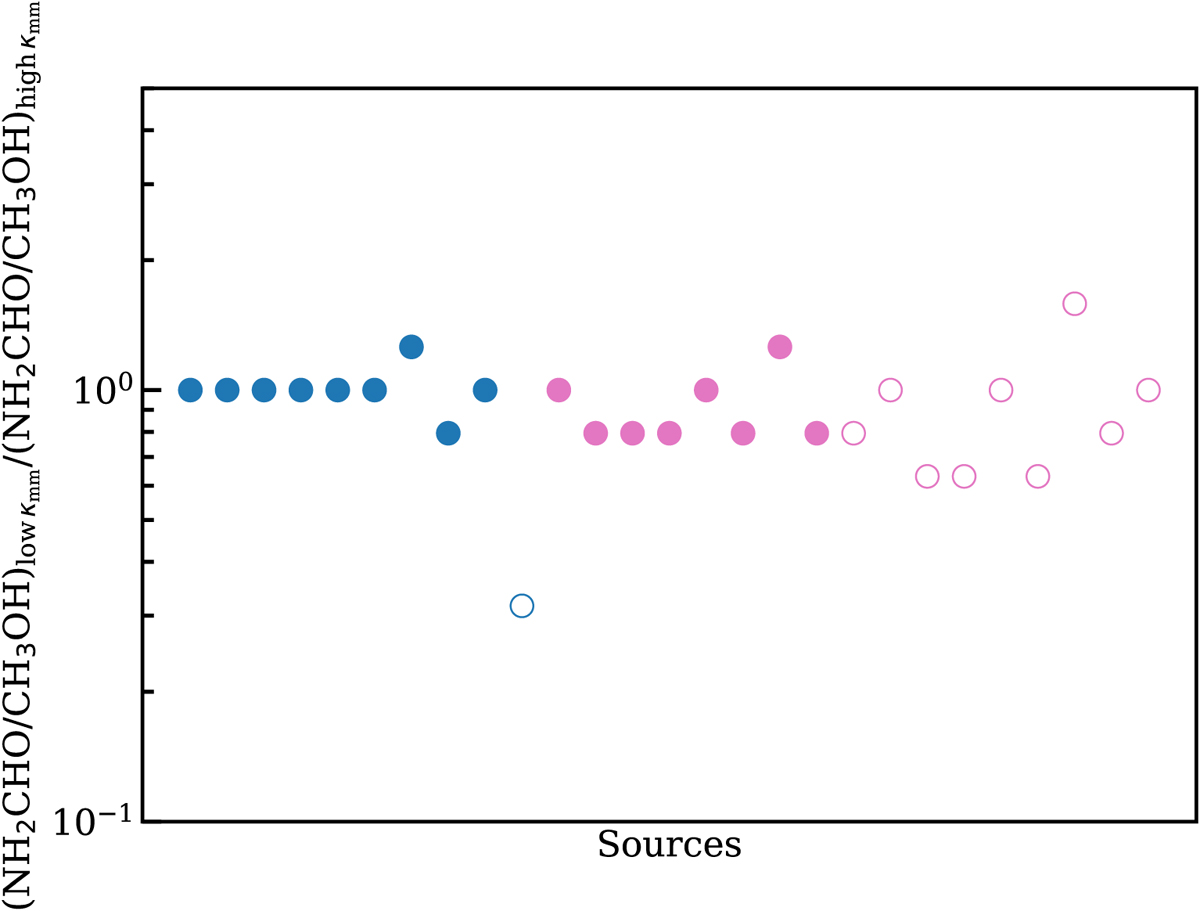
Ratios of ![]() . The numerator and denominator correspond to the same models but with the only difference being low-millimeter opacity versus high-millimeter opacity dust in the models. Pink indicates the high-mass models, and blue shows the low-mass ones. Filled circles are the envelope-only models, and the empty circles are those with a disk. In most of the low-mass envelope-plus-disk models with optically thick dust, methanol was not detected, and thus there is only one blue empty circle. The effect of dust alone on the scatter observed in Fig. 5 is less than a factor of three; thus, most of the scatter in Fig. 5 is driven by the difference in source structure.
. The numerator and denominator correspond to the same models but with the only difference being low-millimeter opacity versus high-millimeter opacity dust in the models. Pink indicates the high-mass models, and blue shows the low-mass ones. Filled circles are the envelope-only models, and the empty circles are those with a disk. In most of the low-mass envelope-plus-disk models with optically thick dust, methanol was not detected, and thus there is only one blue empty circle. The effect of dust alone on the scatter observed in Fig. 5 is less than a factor of three; thus, most of the scatter in Fig. 5 is driven by the difference in source structure.
Current usage metrics show cumulative count of Article Views (full-text article views including HTML views, PDF and ePub downloads, according to the available data) and Abstracts Views on Vision4Press platform.
Data correspond to usage on the plateform after 2015. The current usage metrics is available 48-96 hours after online publication and is updated daily on week days.
Initial download of the metrics may take a while.