Open Access
Fig. 1
Download original image
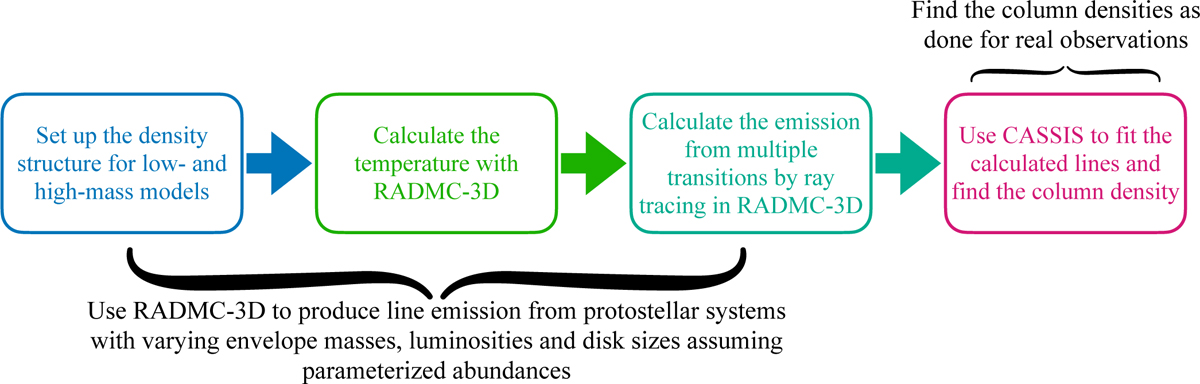
Schematic of our methods. First, RADMC-3D was used to produce the line emission from multiple transitions of methanol, formamide, and methyl cyanide for a grid of models. Then, we used CASSIS to fit those lines and find the column densities.
Current usage metrics show cumulative count of Article Views (full-text article views including HTML views, PDF and ePub downloads, according to the available data) and Abstracts Views on Vision4Press platform.
Data correspond to usage on the plateform after 2015. The current usage metrics is available 48-96 hours after online publication and is updated daily on week days.
Initial download of the metrics may take a while.