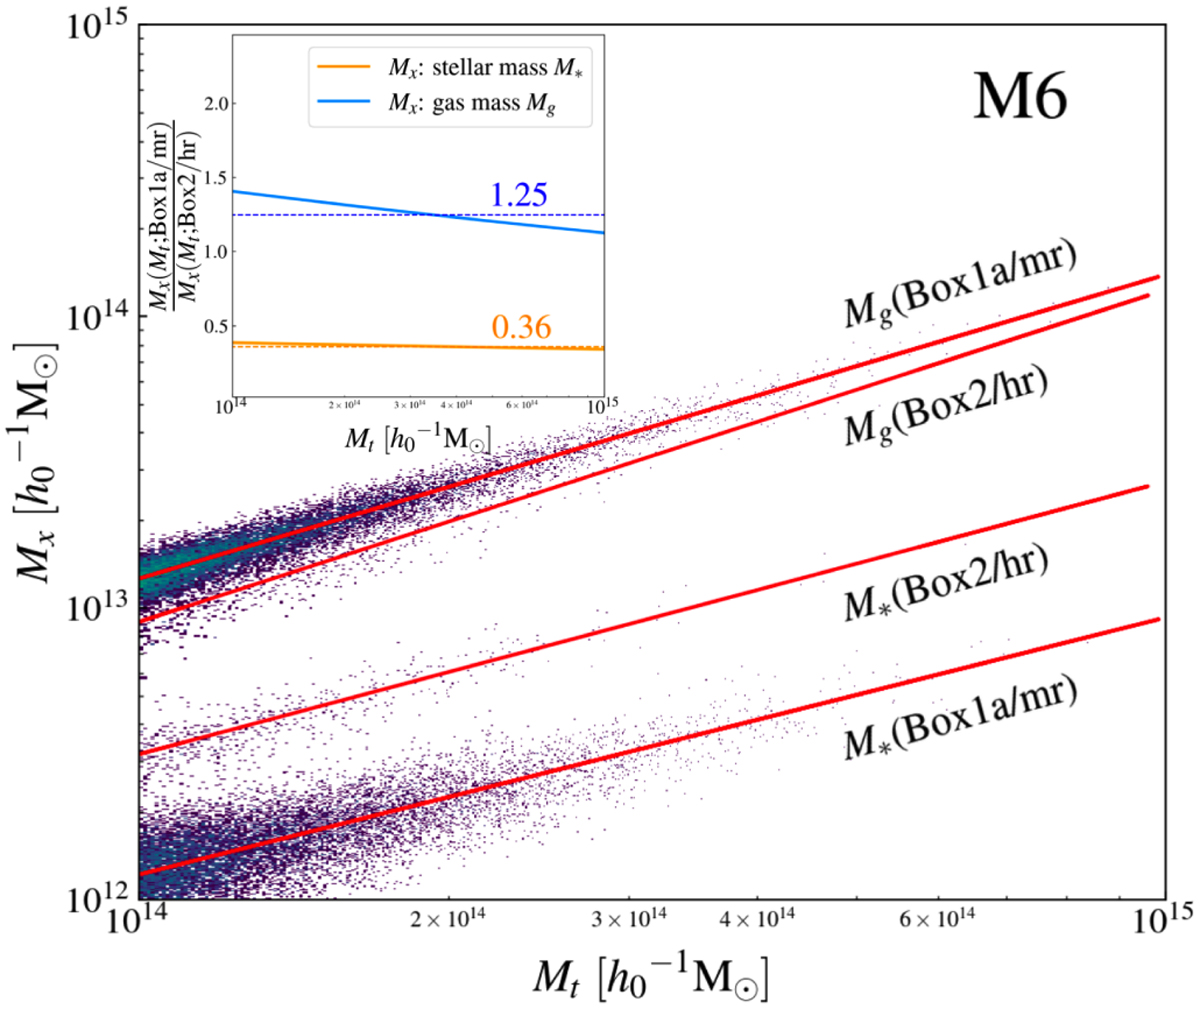
Fig. 14
Download original image
Mg ~ Mt and Mg ~ Mt relationships in the medium-resolution simulation (Box1a/mr) and high-resolution simulation (Box2/hr). The subplot in the upper left corner represents the conversion coefficients of stellar mass (blue) and gas mass (orange) between medium-resolution and high-resolution for a fixed total mass, corresponding to Eq. (8).
Current usage metrics show cumulative count of Article Views (full-text article views including HTML views, PDF and ePub downloads, according to the available data) and Abstracts Views on Vision4Press platform.
Data correspond to usage on the plateform after 2015. The current usage metrics is available 48-96 hours after online publication and is updated daily on week days.
Initial download of the metrics may take a while.