Fig. 9
Download original image
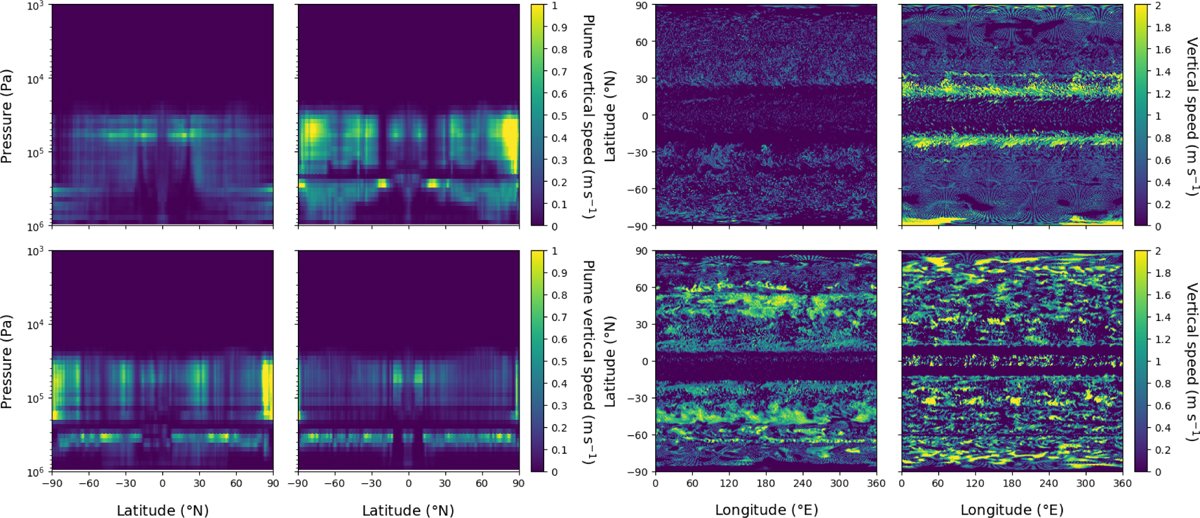
Diagnosing the spatial variability of the vertical speed of idealized plumes in the thermal plume model included in our three-dimensional Jupiter-DYNAMICO simulations. The four-plot arrays on the left and right correspond to the dry (top left) and moist simulations with initial water of 1 SA (top right), 3 SA (bottom left), and 5 SA (bottom right). The left four-plot panel displays the variability of the vertical speed of the zonal-mean plume with pressure and latitude. The right four-plot panel displays the variability of the plume vertical speed with longitude and latitude in the vicinity of the 2 bar level.
Current usage metrics show cumulative count of Article Views (full-text article views including HTML views, PDF and ePub downloads, according to the available data) and Abstracts Views on Vision4Press platform.
Data correspond to usage on the plateform after 2015. The current usage metrics is available 48-96 hours after online publication and is updated daily on week days.
Initial download of the metrics may take a while.