Fig. 8
Download original image
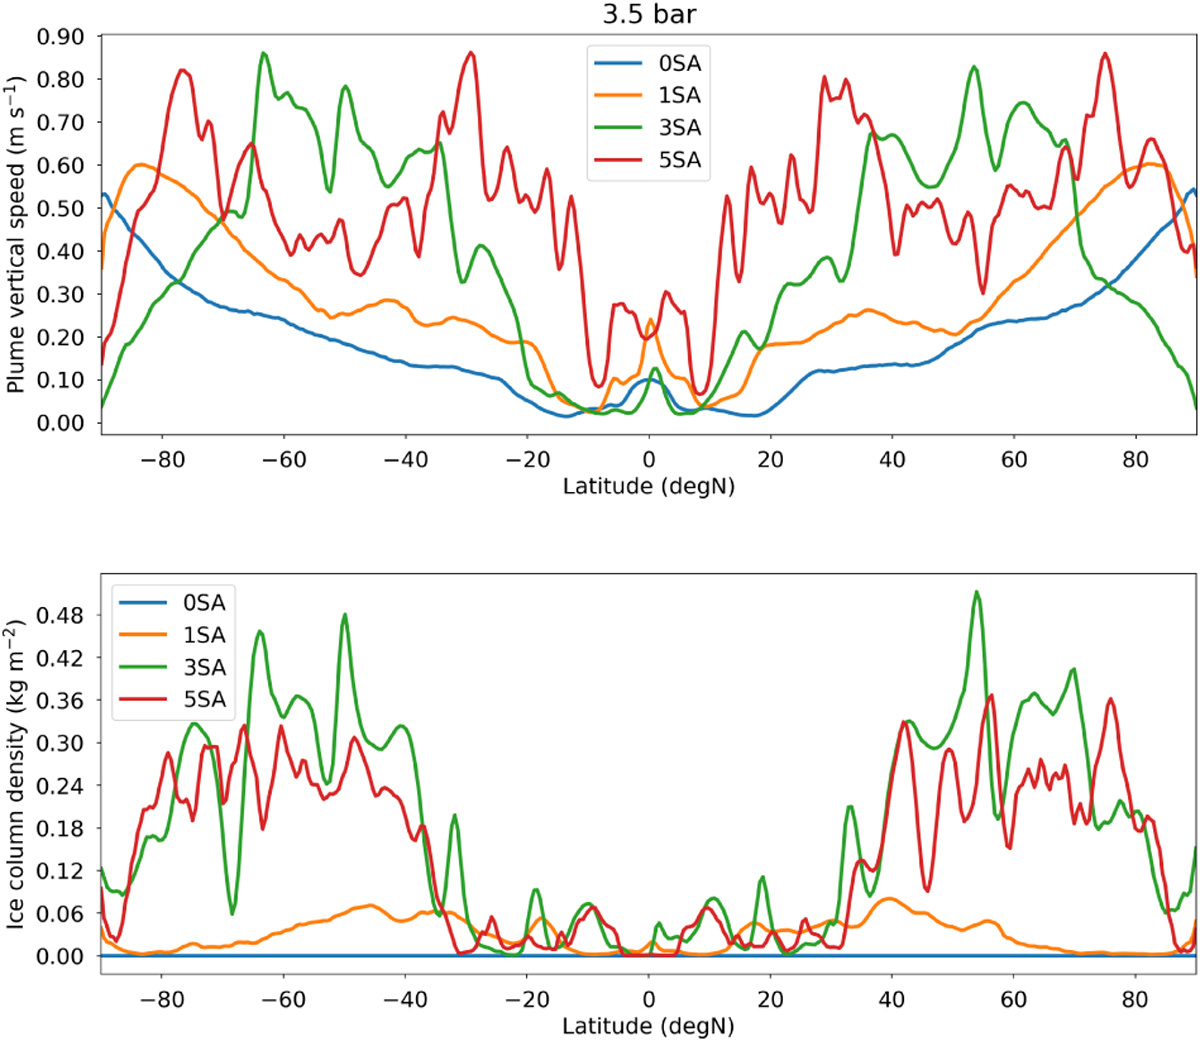
Diagnosing the zonal-mean behavior of the thermal plume model in our three-dimensional Jupiter-DYNAMICO simulations. The diagnostics shown are averaged over all simulated years except for the first year, during which the jet structure is yet to be established. The color coding is similar as in Fig. 7: the dry simulation is shown in blue, and moist simulations are shown in orange (1 SA), green (3 SA), and red (5 SA). The top plot in the vicinity of the 3.5 bar level corresponds to the zonal-mean vertical speed of idealized plumes in the thermal plume model, which is an indication of the strength of the subgrid-scale con-vective motions. The bottom plot corresponds to the zonal-mean water ice column density, which is an indication of clouds simulated by our Jupiter model.
Current usage metrics show cumulative count of Article Views (full-text article views including HTML views, PDF and ePub downloads, according to the available data) and Abstracts Views on Vision4Press platform.
Data correspond to usage on the plateform after 2015. The current usage metrics is available 48-96 hours after online publication and is updated daily on week days.
Initial download of the metrics may take a while.