Fig. 7
Download original image
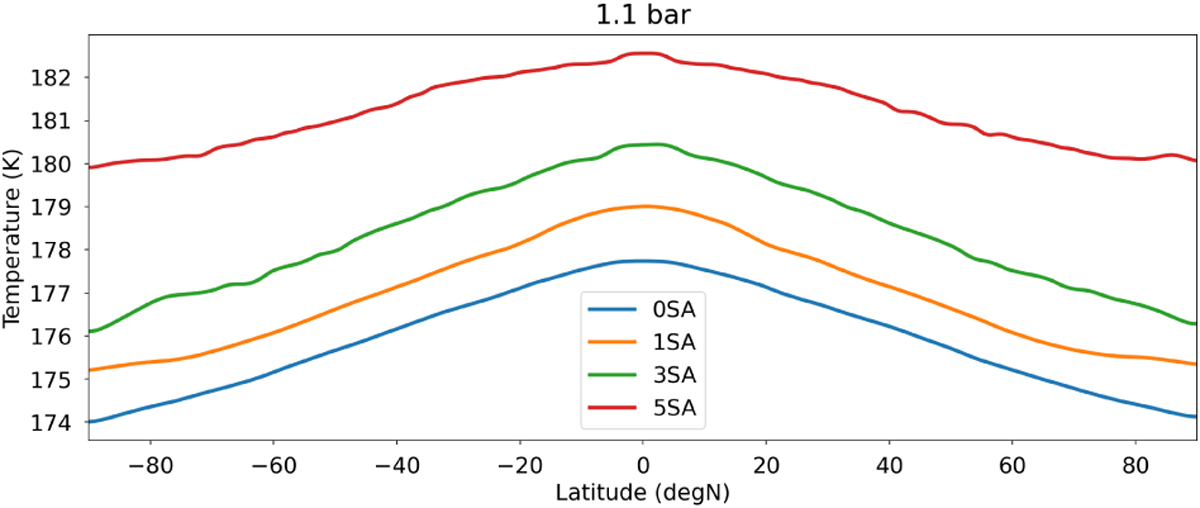
Typical meridional thermal structure in our Jupiter-DYNAMICO simulations, shown by the zonal-mean temperature at the 1 bar level as a function of latitude (average of all simulated years except for the first year, during which the jet structure is yet to be established). The dry simulation is shown in blue, and the moist simulations are shown in orange (1 SA), green (3 SA), and red (5 SA).
Current usage metrics show cumulative count of Article Views (full-text article views including HTML views, PDF and ePub downloads, according to the available data) and Abstracts Views on Vision4Press platform.
Data correspond to usage on the plateform after 2015. The current usage metrics is available 48-96 hours after online publication and is updated daily on week days.
Initial download of the metrics may take a while.