Fig. 5
Download original image
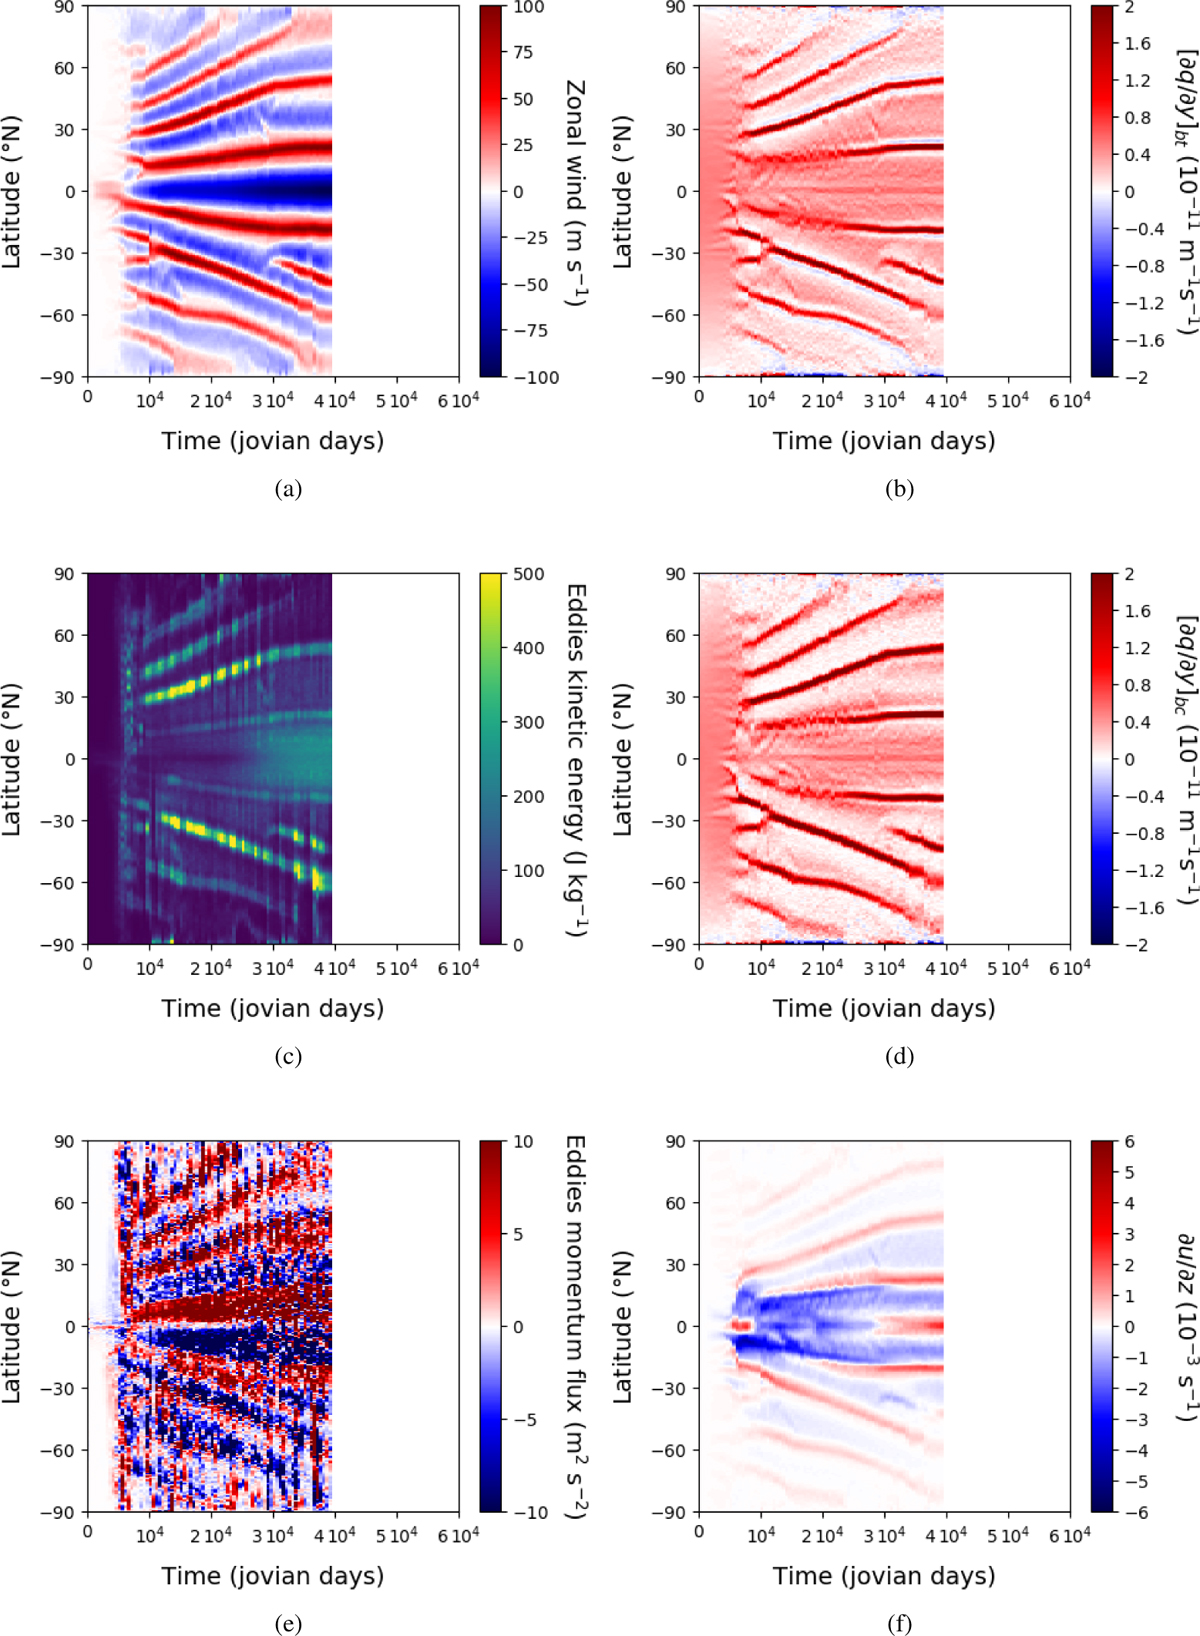
Dynamical atlas of the dry atmosphere simulation with Jupiter-DYNAMICO showing the temporal evolution of the main diagnostics for tropospheric dynamics on Jupiter. Although the model integrations were conducted during 40 000 Jovian days, the temporal axis extends toward 60 000 days for easy comparison with the moist cases described in Sect. 5. The variables shown (see text for further definitions, especially Sect. 4.3) are all zonally averaged. The left column displays the zonal wind (top, panel a), the eddy kinetic energy (middle, panel c), and the eddy momentum flux (bottom, panel e). The right column displays the barotropic potential vorticity [∂q|∂y]bt (top, panel b), the baroclinic potential vorticity [∂q/∂y]bc (middle, panel d), and the zonal wind vertical shear (bottom, panel f). The left column corresponds to flow properties at p = 1 bar, and the right column corresponds to instability diagnostics, shown at p = 0.1 bar for comparison purposes because the baroclinic potential vorticity [∂q/∂y]bc is not defined in the barotropic troposphere.
Current usage metrics show cumulative count of Article Views (full-text article views including HTML views, PDF and ePub downloads, according to the available data) and Abstracts Views on Vision4Press platform.
Data correspond to usage on the plateform after 2015. The current usage metrics is available 48-96 hours after online publication and is updated daily on week days.
Initial download of the metrics may take a while.