Fig. 2
Download original image
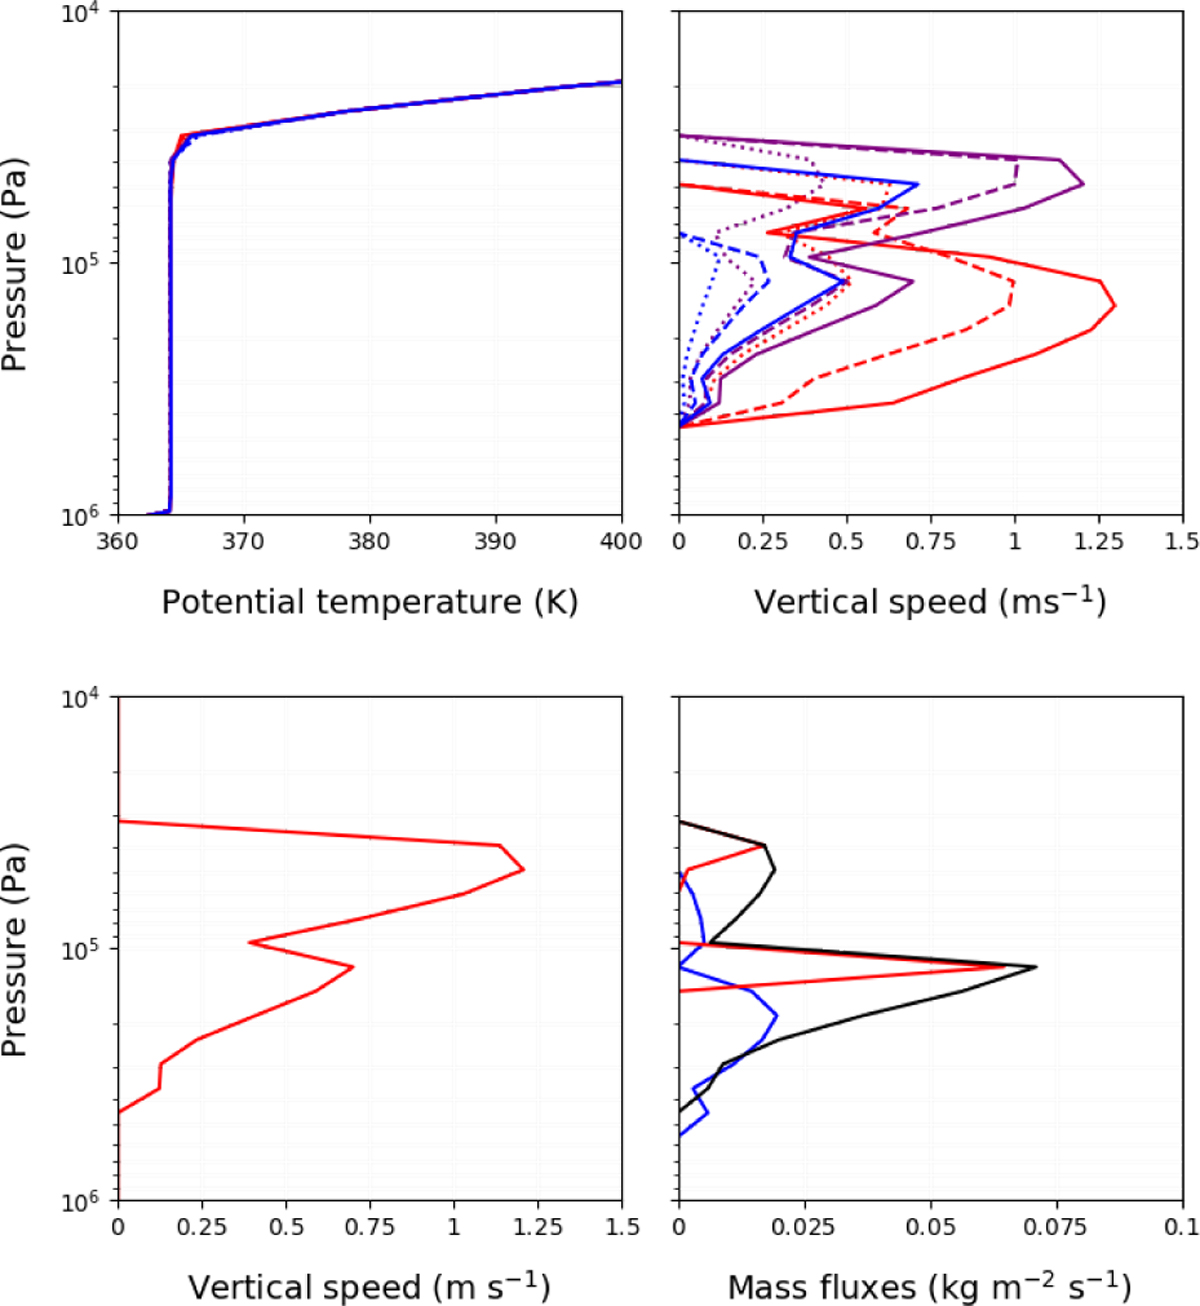
Behavior of the thermal plume model in one-dimensional Jupiter dry simulations (after 1000 Jovian days). The two top plots display the vertical profiles of the potential temperature (left) and vertical plume speed (right). Nine combinations using three values of the buoyancy coefficient a and the fluid friction factor b are shown: a = 0.1/0.5/0.9 (dotted, dashed, and solid lines) and b = 0/10−4/2 × 10−4 m−1 (red, purple, and blue lines). The two bottom plots show the case a = 0.9 and b = 10−4 m−1. They show the vertical plume speed on the left and the mass fluxes on the right (entrainment in blue, detrainment in red, and vertical mass flux in black).
Current usage metrics show cumulative count of Article Views (full-text article views including HTML views, PDF and ePub downloads, according to the available data) and Abstracts Views on Vision4Press platform.
Data correspond to usage on the plateform after 2015. The current usage metrics is available 48-96 hours after online publication and is updated daily on week days.
Initial download of the metrics may take a while.