Fig. 15
Download original image
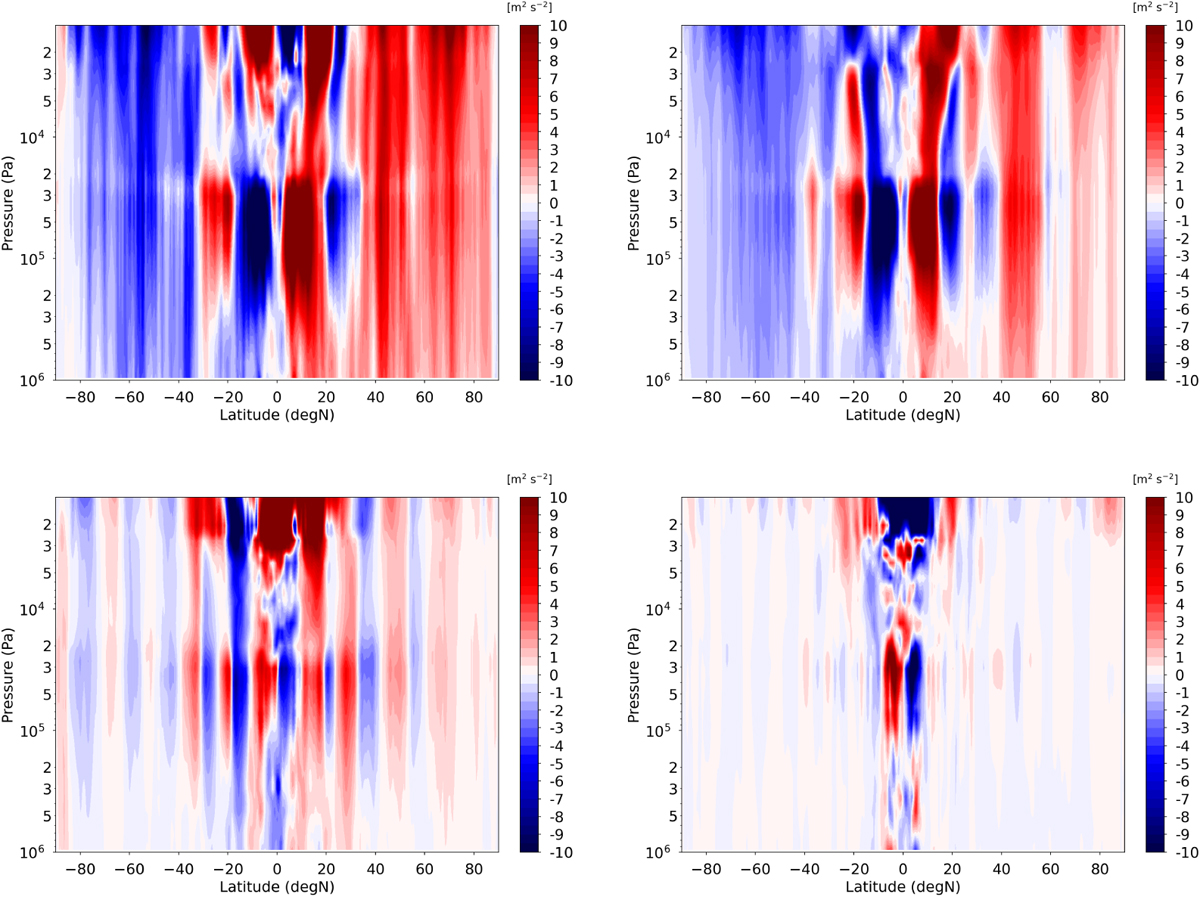
Latitudinal and vertical perspective of the zonal-mean eddy momentum fluxes in our Jupiter-DYNAMICO GCM simulations: 0SA (top left), 1SA (top right), 3SA (bottom left), and 5SA (bottom right). This figure is a complement to Figs. 5e, 12e, 13e, 14e. The diagnostics shown are averaged over all simulated years except for the first year, during which the jet structure is yet to be established.
Current usage metrics show cumulative count of Article Views (full-text article views including HTML views, PDF and ePub downloads, according to the available data) and Abstracts Views on Vision4Press platform.
Data correspond to usage on the plateform after 2015. The current usage metrics is available 48-96 hours after online publication and is updated daily on week days.
Initial download of the metrics may take a while.