Fig. 10
Download original image
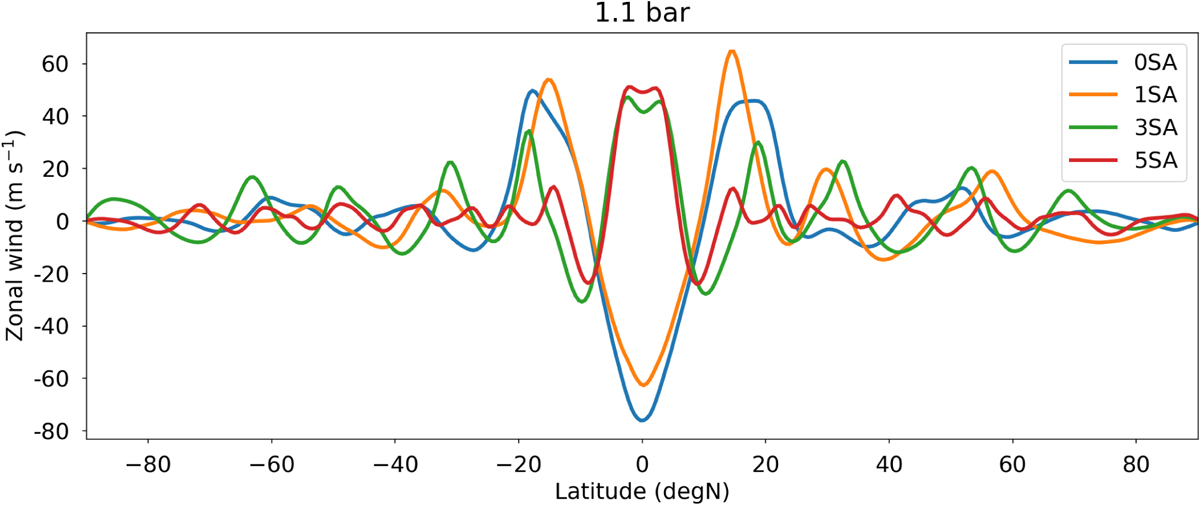
Jovian jets at the 1 bar level as simulated by our Jupiter-DYNAMICO GCM using the thermal plume model. The diagnostics shown are averaged over all simulated years except for the first year, during which the jet structure is yet to be established). The color coding is similar as in Fig. 7: the dry simulation is shown in blue, and moist simulations are shown in orange (1 SA), green (3 SA), and red (5 SA). This figure may be compared to cloud-tracking observations of Jovian jets (e.g., Fig. 1 in both Porco et al. 2003; Kaspi et al. 2018) and shows that the strong equatorial jet in the troposphere of Jupiter is obtained in our Jupiter-DYNAMICO simulations only in moist conditions with an initial amount of water of 3 SA or 5 SA.
Current usage metrics show cumulative count of Article Views (full-text article views including HTML views, PDF and ePub downloads, according to the available data) and Abstracts Views on Vision4Press platform.
Data correspond to usage on the plateform after 2015. The current usage metrics is available 48-96 hours after online publication and is updated daily on week days.
Initial download of the metrics may take a while.