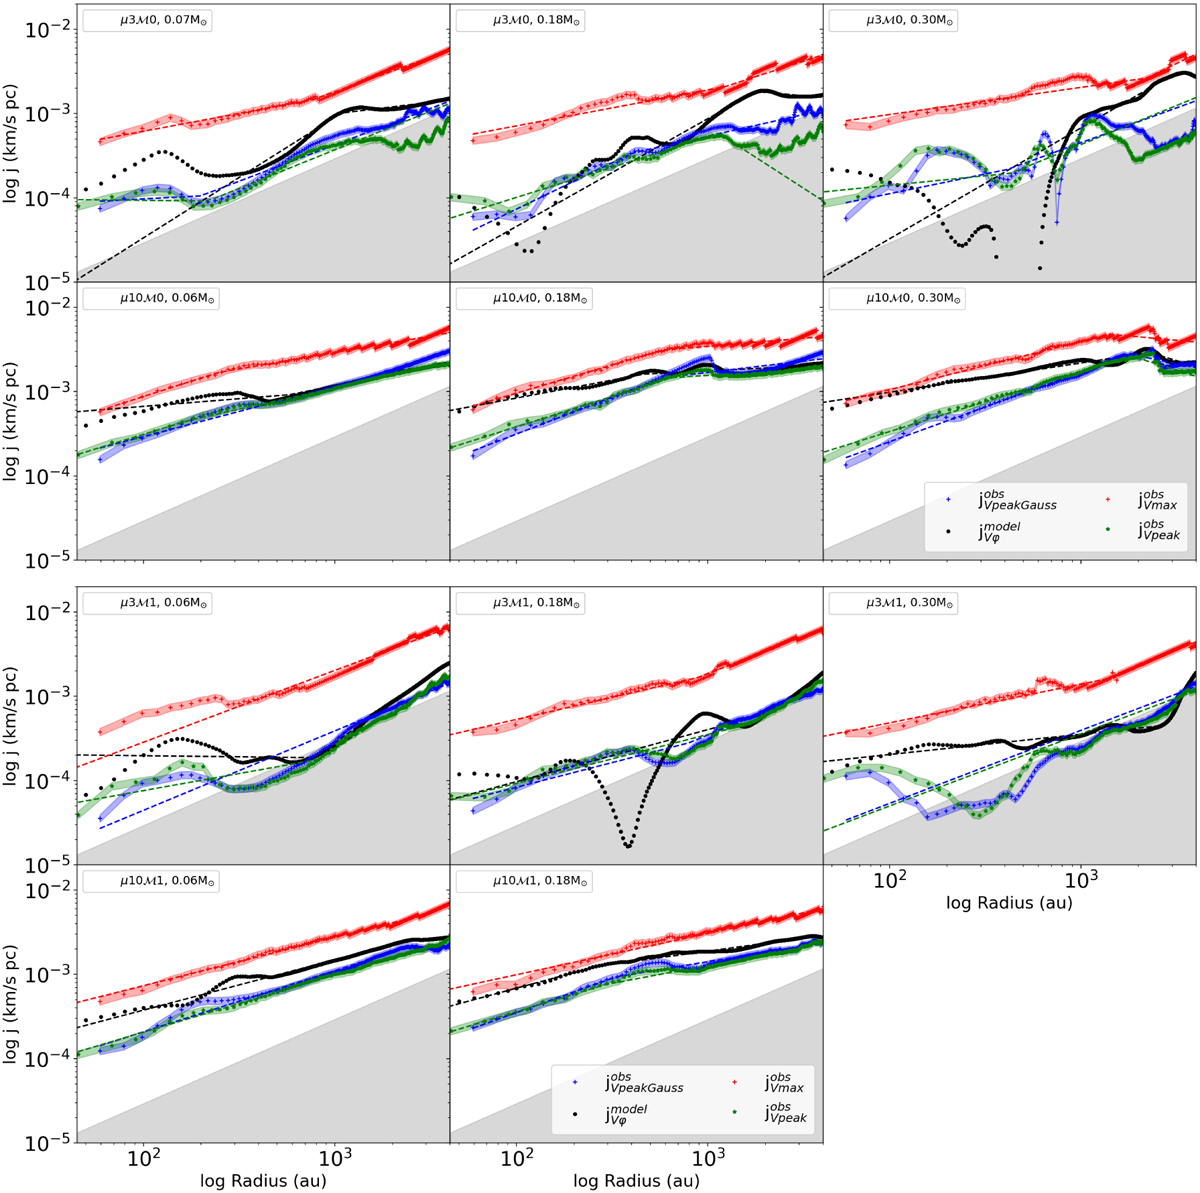
Fig. 7
Download original image
SAM of the gas: radial profiles computed along the equatorial plane. They are computed from the gas velocity in the model’s outputs, and from the velocity recovered with synthetic observations of the C18O (2−1) line emission. Model: black circles show 3D SAM computed considering the azimuthally averaged rotational (νϕ) velocity component. Synthetic observation: Red crosses show the SAM computed from the maximum velocity. Green stars show the SAM computed from the intensity-weighted velocity (moment 1). Blue circles show the SAM computed from the Gaussian-fitted peak velocity. The shaded gray area represents the region beyond the velocity resolution. Red, green, and blue shadows show error bars on the synthetic data.
Current usage metrics show cumulative count of Article Views (full-text article views including HTML views, PDF and ePub downloads, according to the available data) and Abstracts Views on Vision4Press platform.
Data correspond to usage on the plateform after 2015. The current usage metrics is available 48-96 hours after online publication and is updated daily on week days.
Initial download of the metrics may take a while.